
FIGURE
Figure 6
- ID
- ZDB-FIG-211201-149
- Publication
- Venuto et al., 2021 - Evaluating the Death and Recovery of Lateral Line Hair Cells Following Repeated Neomycin Treatments
- Other Figures
- All Figure Page
- Back to All Figure Page
Figure 6
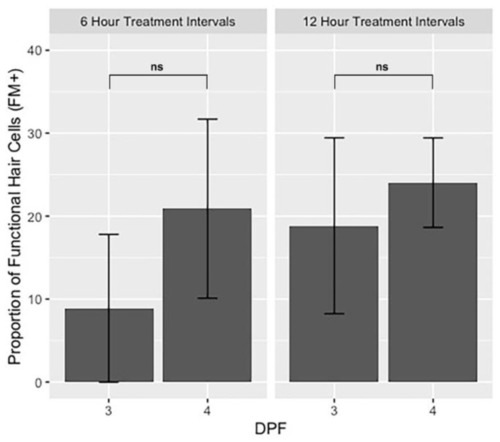
Bar graphs showing the proportion of functional hair cells (FM+) relative to total hair cells (GFP+) one hour after 50 µM neomycin treatments on 3 days post-fertilization (dpf) (I1) and 4 dpf (I3) for both 6-h and 12-h timelines. Error bars represent standard deviation, n = 15 for each group. Two-tailed z-score test for proportions was used to evaluate the difference between the proportion of hair cells at 3 and 4 dpf. ns = not significant. |
Expression Data
Expression Detail
Antibody Labeling
Phenotype Data
Phenotype Detail
Acknowledgments
This image is the copyrighted work of the attributed author or publisher, and
ZFIN has permission only to display this image to its users.
Additional permissions should be obtained from the applicable author or publisher of the image.
Full text @ Life (Basel)