
|
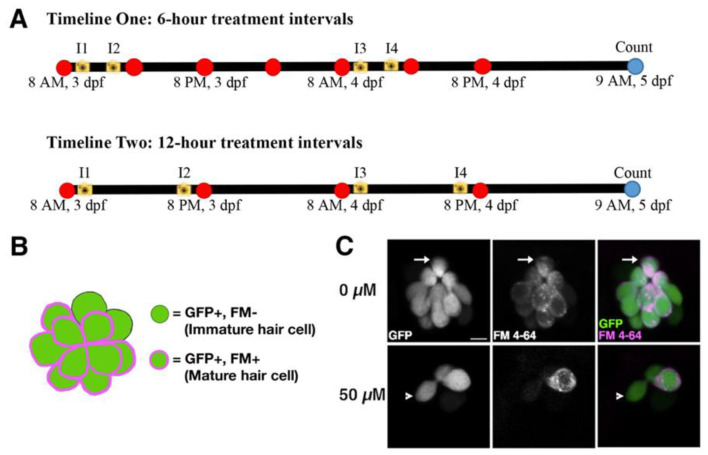
Figure 1
Experimental set-up. (A) The 6-h and 12-h treatment timelines with neomycin concentrations of 0, 50, 200, 300, and 400 µM beginning 8 a.m. at 3 days post-fertilization (dpf). Red dots indicate treatment timepoints, yellow cameras indicate imaging timepoints for hair cell counts (I1–I4), and blue dots indicate final count of surviving larvae. (B) Representation of a neuromast showing the strategy used to differentiate between mature and immature hair cells. Mature cells are labelled with both GFP and FM 4-64, while immature cells are labelled with GFP, but not FM 4-64. (C) Representative confocal images of O2 neuromasts at imaging timepoint I1 in the 0 and 50 µM neomycin treatment groups. The Tg(myo6b:eGFP-pA)vo68Tg line is green and FM 4-64 is magenta in the merge of the two channels in the third column. The full arrow indicates a functional hair cell positive for both GFP and FM 4-64. The arrowhead indicates an ototoxin-resistant, immature hair cell that is positive for GFP only. Scale bar = 5 µm. Additional representative images from imaging timepoints I1-I4 are provided in Figure S1.