
Image
|
Figure Caption
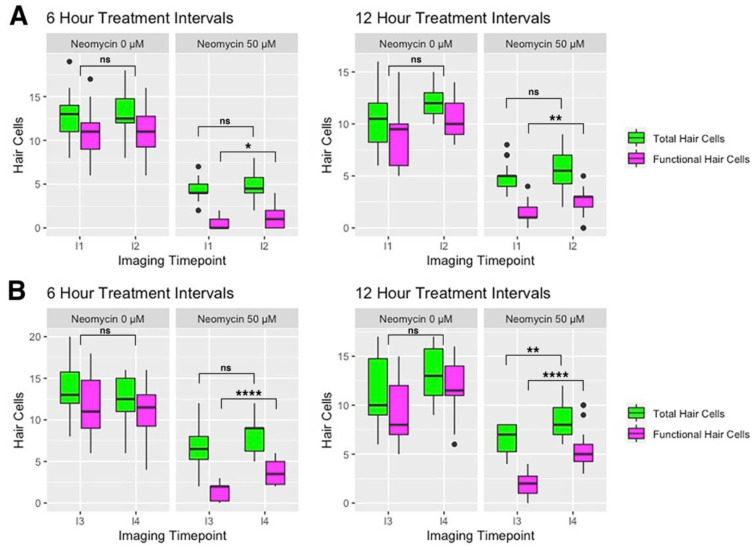
Figure 5
Comparison of hair cell counts in the 0 µM and 50 µM neomycin treatment groups at (A) 3 dpf and (B) 4 dpf. Green boxplots indicate cell counts using the GFP transgene to mark both transducing and non-transducing hair cells, and the magenta boxplots indicate hair cell counts using FM 4-64 to label mechanically sensitive hair cells. See Figure 1A for timing of imaging timepoints I1-I4. Kruskal–Wallis ANOVA with Dunn post-test was performed to find significance levels, which are as follows: **** = p < 0.0001, ** = p < 0.01, * = p < 0.05, ns = not significant.
Acknowledgments
This image is the copyrighted work of the attributed author or publisher, and
ZFIN has permission only to display this image to its users.
Additional permissions should be obtained from the applicable author or publisher of the image.
Full text @ Life (Basel)