
- Title
-
Differential Clearance of Aβ Species from the Brain by Brain Lymphatic Endothelial Cells in Zebrafish
- Authors
- Jeong, Y.M., Lee, J.G., Cho, H.J., Lee, W.S., Jeong, J., Lee, J.S.
- Source
- Full text @ Int. J. Mol. Sci.
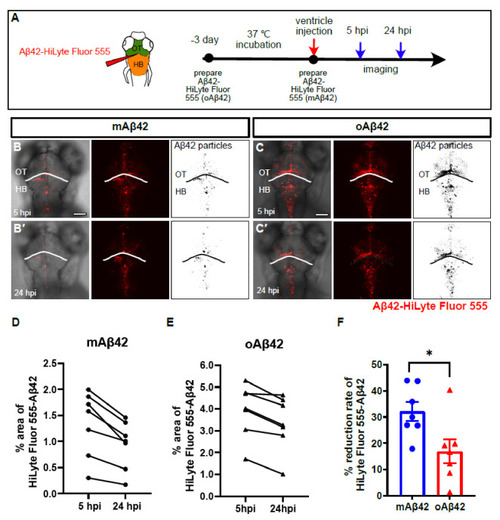
Monomeric Aβ42 peptides are more efficiently cleared from the brain than oligomeric Aβ42. (A) A schematic diagram of experimental setup. Fluorescently labeled Aβ42 prepared at different time points were injected into the brain followed by in vivo imaging at 5 hpi and 24 hpi. (B,C′) Distribution of injected, fluorescently labeled Aβ42 (mAβ42 or oAβ42) in the brains of 3 dpf larvae at 5 hpi (B,C) and 24 hpi (B′,C′) (left, overlays with brightfield; middle, HiLyte Fluor 555; right, thresholded images of Aβ42 fluorescence). (D,E) Quantification of the area fraction (%) occupied by Aβ42 fluorescence within square unit (512 × 512 pixels) at different time points. (F) Clearance rate of mAβ42 and oAβ42 between 5 hpi and 24 hpi by fluorescence quantification. Two-tailed unpaired t-test, p = 0.023. Data are presented as mean ± SEM. N = 7 per group. Data are representative of at least three independent experiments. dpf, days post fertilization; hpi, hours post injection; HB, hindbrain; OT, optic tectum, Scale bars = 100 μm. * p < 0.05. |
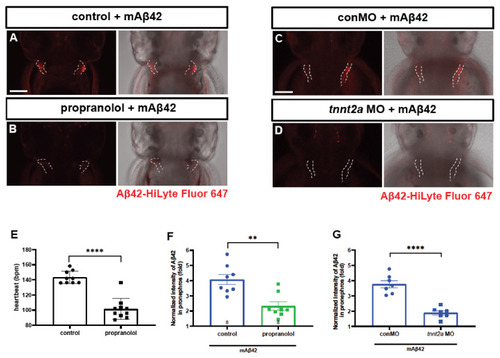
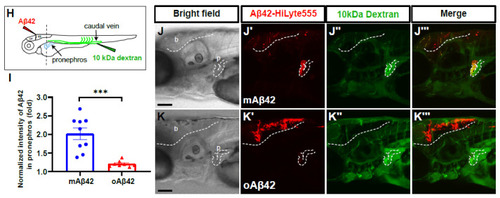
Cleared mAβ42 accumulates in the pronephros via blood flow. (A,B) mAβ42-injected larvae after propranolol (100 μM) treatment. The mAβ42 intensity in the pronephros of propranolol-treated larvae (white dotted lines) decreased (B) compared to control (A). (C,D) mAβ42-injected larvae after control morphants (C) and 200 μM tnnt2a morphants (D). (E) Quantification of heartbeats upon propranolol treatment. n = 9 for control group, n = 10 for propranolol. (F) Quantification of the mAβ42 intensity in the pronephros after propranolol treatment. n = 8 per group. (G) Quantification of the mAβ42 intensity in the pronephros of control and tnnt2a morphants. Statistical significance was determined by two tailed unpaired t-test. Data are presented as mean ± SEM. n = 9 per group. Data are representative of at least three independent experiments. (H) A schematic diagram of experimental setting of Aβ and tracer injection. mAβ42 or oAβ42 (HiLyte) was injected into ventricle and 10 kDa Dextran was injected into caudal vein. (I) Quantification of the Aβ42 fluorescence intensity in the pronephros normalized by background fluorescence. n = 9 for mAβ42, n = 8 for oAβ42. Data are representative of at least three independent experiments. (J–K‴) Confocal fluorescence images showing the brain and pronephros of zebrafish with lateral view after mAβ42 (J) or oAβ42 (K) injection at 3 dpf. Red fluorescence indicates Aβ42-HiLyte Fluor and green fluorescence show 10 kDa dextran tracer injected into caudal vein. (J′) Ventricle-injected mAβ42 was seen in the pronephros region (white dotted lines and depicted as p). (K′) Ventricle-injected oAβ42 was seen only in the brain region (b), but not detected in the pronephros. Caudal vein-injected dextran accumulated in the pronephros of both mAβ42 and oAβ42-injected larvae (J″,K″). (J‴,K‴) show merged images. b, brain; MO, morpholino; p, pronephros; Scale bars = 100 μm. ** p < 0.001; *** p < 0.0005; **** p < 0.0001. |
Cleared mAβ42 accumulates in the pronephros via blood flow. (A,B) mAβ42-injected larvae after propranolol (100 μM) treatment. The mAβ42 intensity in the pronephros of propranolol-treated larvae (white dotted lines) decreased (B) compared to control (A). (C,D) mAβ42-injected larvae after control morphants (C) and 200 μM tnnt2a morphants (D). (E) Quantification of heartbeats upon propranolol treatment. n = 9 for control group, n = 10 for propranolol. (F) Quantification of the mAβ42 intensity in the pronephros after propranolol treatment. n = 8 per group. (G) Quantification of the mAβ42 intensity in the pronephros of control and tnnt2a morphants. Statistical significance was determined by two tailed unpaired t-test. Data are presented as mean ± SEM. n = 9 per group. Data are representative of at least three independent experiments. (H) A schematic diagram of experimental setting of Aβ and tracer injection. mAβ42 or oAβ42 (HiLyte) was injected into ventricle and 10 kDa Dextran was injected into caudal vein. (I) Quantification of the Aβ42 fluorescence intensity in the pronephros normalized by background fluorescence. n = 9 for mAβ42, n = 8 for oAβ42. Data are representative of at least three independent experiments. (J–K‴) Confocal fluorescence images showing the brain and pronephros of zebrafish with lateral view after mAβ42 (J) or oAβ42 (K) injection at 3 dpf. Red fluorescence indicates Aβ42-HiLyte Fluor and green fluorescence show 10 kDa dextran tracer injected into caudal vein. (J′) Ventricle-injected mAβ42 was seen in the pronephros region (white dotted lines and depicted as p). (K′) Ventricle-injected oAβ42 was seen only in the brain region (b), but not detected in the pronephros. Caudal vein-injected dextran accumulated in the pronephros of both mAβ42 and oAβ42-injected larvae (J″,K″). (J‴,K‴) show merged images. b, brain; MO, morpholino; p, pronephros; Scale bars = 100 μm. ** p < 0.001; *** p < 0.0005; **** p < 0.0001. |
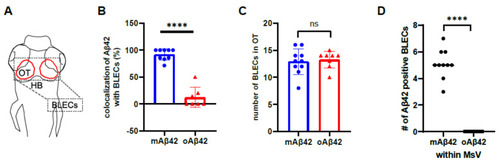
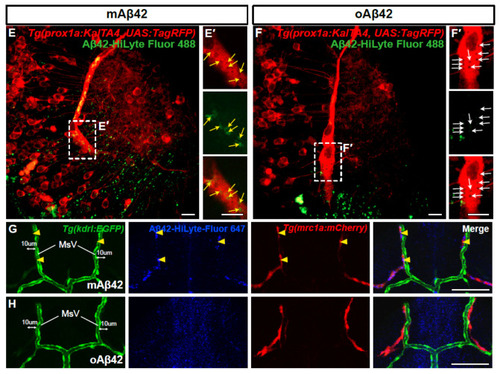
Brain lymphatic endothelial cells take up monomeric Aβ42, but not oligomeric Aβ42. (A) A schematic diagram of the larval brain with the dorsal view. Red lines in the dotted box depict the loop structure of the brain lymphatic endothelial cells (BLECs) in the optic tectum. (B) Quantification of the co-localization of Aβ42 with BLECs. Data are presented as mean ± SEM. n = 9 for mAβ42 and n = 7 for oAβ42. Statistical significance was determined by two-tailed unpaired t-test. (C) Quantification of the numbers of mrc1a+ BLECs in the optic tectum after mAβ42 or oAβ42 injection in the Tg(mrc1a:mCherry). Data are presented as mean ± SEM. n = 9 per group. (D) Quantification of the number of Aβ42 positive BLECs nearby (within 10 μm) mesencephalic vein (MsV) region showing mrc1a+ positivity. Statistical significance was determined by ordinary one-way ANOVA with Tukey’s test. n = 10 for mAβ42 and n = 8 for oAβ42. (E,F) Confocal projections of prox1a:RFP+ BLECs and Aβ42-HiLyte Fluor 488. (E′,F′) High magnification of dotted boxes in (E,F) showing endocytic vesicles of BLECs. mAβ42-injected BLECs showed robust uptake of mAβ42 into endocytic vesicles ((E′), yellow arrows) whereas oAβ42-injected did weak uptake ((F′), white arrows). Scale bars in (E–F′) = 10 μm. (G,H) Confocal fluorescence images of the brain optic tectum region with double transgenic Tg(kdrl:EGFP); Tg(mrc1a:mCherry) larvae after Aβ42 injection (HiLyte Fluor 647-Aβ42) at 3 dpf. mAβ42 fluorescence detected in the neighboring (within 10 μm) kdrl:EGFP+ cerebrovasculature was mostly co-localized with mrc1a:mCherry+ BLECs (yellow arrowheads) (G), whereas oAβ42 (H) fluorescence neighboring kdrl:EGFP+ cerebro-vasculatures was not. HB, hindbrain; OT, optic tectum; MsV, mesencephalic vein; Scale bars in (G,H) = 50 μm. ns, not significant; **** p < 0.0001. |
Brain lymphatic endothelial cells take up monomeric Aβ42, but not oligomeric Aβ42. (A) A schematic diagram of the larval brain with the dorsal view. Red lines in the dotted box depict the loop structure of the brain lymphatic endothelial cells (BLECs) in the optic tectum. (B) Quantification of the co-localization of Aβ42 with BLECs. Data are presented as mean ± SEM. n = 9 for mAβ42 and n = 7 for oAβ42. Statistical significance was determined by two-tailed unpaired t-test. (C) Quantification of the numbers of mrc1a+ BLECs in the optic tectum after mAβ42 or oAβ42 injection in the Tg(mrc1a:mCherry). Data are presented as mean ± SEM. n = 9 per group. (D) Quantification of the number of Aβ42 positive BLECs nearby (within 10 μm) mesencephalic vein (MsV) region showing mrc1a+ positivity. Statistical significance was determined by ordinary one-way ANOVA with Tukey’s test. n = 10 for mAβ42 and n = 8 for oAβ42. (E,F) Confocal projections of prox1a:RFP+ BLECs and Aβ42-HiLyte Fluor 488. (E′,F′) High magnification of dotted boxes in (E,F) showing endocytic vesicles of BLECs. mAβ42-injected BLECs showed robust uptake of mAβ42 into endocytic vesicles ((E′), yellow arrows) whereas oAβ42-injected did weak uptake ((F′), white arrows). Scale bars in (E–F′) = 10 μm. (G,H) Confocal fluorescence images of the brain optic tectum region with double transgenic Tg(kdrl:EGFP); Tg(mrc1a:mCherry) larvae after Aβ42 injection (HiLyte Fluor 647-Aβ42) at 3 dpf. mAβ42 fluorescence detected in the neighboring (within 10 μm) kdrl:EGFP+ cerebrovasculature was mostly co-localized with mrc1a:mCherry+ BLECs (yellow arrowheads) (G), whereas oAβ42 (H) fluorescence neighboring kdrl:EGFP+ cerebro-vasculatures was not. HB, hindbrain; OT, optic tectum; MsV, mesencephalic vein; Scale bars in (G,H) = 50 μm. ns, not significant; **** p < 0.0001. |
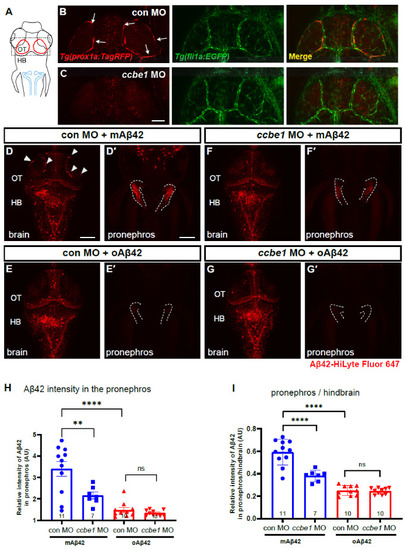
BLECs depletion decreases peripheral transport of mAβ42 to the pronephros. (A) A schematic diagram of zebrafish 3 dpf larvae with dorsal view. Dotted box depicts the loop structure of BLECs in the optic tectum. Blue lines depict the pronephros. (B,C) Confocal fluorescence images of the brain optic tectum region with Tg(prox1a:TagRFP); Tg(fli1a:EGFP) that labels BLECs and brain vasculatures simultaneously. Control morphant (B) and ccbe1 morphant (C) at 3 dpf with BLECs depleted in the brain with intact vasculatures. Scale bar in C = 50 μm. (D–G) Dorsal view of the larval brains of control (D,E) and ccbe1 morphants (F,G) 4 h after Aβ42 injection at 3 dpf. Red fluorescence represents Aβ42-HiLyte Fluor 647. mAβ42 is seen in BLECs (arrowheads) in the control morphants (D) but not in the ccbe1 morphants (F). (D′,E′,F′,G′) Confocal images of zebrafish pronephros (dotted lines) after Aβ42 (the same fish with brain images). The robust pronephric accumulation of Aβ42 was detectable in mAβ42-injected control (D′), but the reduced pronephric delivery of mAβ42 was observed in ccbe1 morphants (F′) compared to control. oAβ42 injection into both control and ccbe1 morphants show almost no pronephric accumulation of Aβ42 (E′,G′). Scale bars = 100 μm. (H) Quantification of Aβ42 intensity in the pronephros, normalized by the intensity of non-fluorescent background. (I) Quantification of the relative intensity ratio between the pronephros and hindbrain. Statistical significance was determined by ordinary one-way ANOVA with Tukey’s test. HB, hindbrain; MO, morpholino; OT, optic tectum; n, independent biological samples or animals. Numbers within bar bottom graphs represent n. **, p < 0.01; ****, p < 0.0001; ns, not significant. |
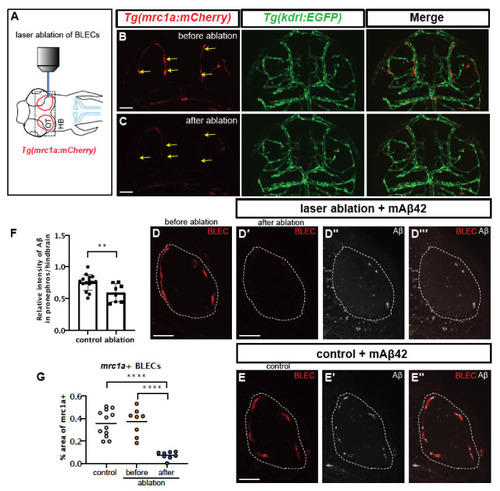
Selective ablation of BLECs decreased internalization of mAβ42 and pronephric accumulation. (A) A schematic diagram of the experimental setting. BLEC-specific ablation using the confocal laser. (B,C) Confocal images of BLECs in the double transgenic Tg(mrc1a:mCherry); Tg(kdrl:EGFP) at 3 dpf before laser irradiation (B) and after ablation (C). Yellow arrows indicate the ablated BLECs. Scale bars = 50 μm. (D) Confocal images of mrc1a+ BLECs in the loop of the optic before ablation (D) and after ablation and mAβ42 injection (D′–D‴). (D′) shows red channel, (D″) shows mAβ42 (HiLyte647, white) and (D‴) is a merged image. Dotted lines denote the loop of BLECs. (E) Confocal images of mrc1a+ BLECs with mAβ42 injection (non-ablated control). Scale bars = 50 μm. (E′) shows mAβ42 (HiLyte647, white) and (E’’) shows merged images of BLECs and mAβ42. (F) Quantification of the relative intensity ratio between the pronephros and hindbrain. Data are presented as mean ± SEM. Statistical significance was determined by two-tailed unpaired t-test. n = 15 for non-ablated control, n = 8 for ablated. p = 0.0092. (G) Quantification of area fraction (%) occupied by mrc1a+ BLECs. Data are presented as mean ± SEM. Statistical significance was determined by ordinary one-way ANOVA with Tukey’s test. **, p < 0.01; ****, p < 0.0001. |

Mannan administration reduces uptake of mAβ42 by BLECs and peripheral transport. (A) A schematic diagram of dorsal view of the 3 dpf larval brain and the experimental setup. Dotted gray box denotes the region of interest. (B,C) Confocal images of mrc1a:mCherry+ BLECs co-injected with pHrodoGreen and mAβ42 (HiLyte Fluor 647). Arrows indicate colocalization of pHrodoGreen and mAβ42 (B). Empty arrowheads show that the mannan administration interferes with colocalization of pHrodoGreen and mAβ42. Data are representative of at least three independent experiments. Scale bars = 10 μm. (D,E) Confocal images of the zebrafish pronephros after mAβ42 injection. Dotted lines depict the pronephros structure. Arrowheads indicate the accumulation of mAβ42. Mannan treatment prior to mAβ42 injection (E) resulted in a reduced pronephric accumulation compared to PBS control (D). Scale bars = 100 μm. (F) Quantification of the relative ratio of the intensity between the pronephros and brain. Statistical significance was determined by two-tailed unpaired t-test. p = 0.0092. Data are presented as mean ± SEM. n = 9 per group. Data are representative of at least two independent experiments. **, p < 0.01. |

EPPS treatment enhances the BLEC localization and pronephric transport of oAβ42. (A) A schematic diagram of EPPS treatment after oAβ42 (HiLyte-Fluor 647) injection. Gray dotted box depicts the region of interest and blue lines indicate the pronephros. (B–E) Confocal images of prox1a:RFP+ BLECs in the loop of the optic tectum of oAβ42-injected larval brain with control (B,D) and EPPS treatment (C,E). (B,C) Co-localization of BLECs with oAβ42 increased upon EPPS treatment (arrows) in c compared to control (B). Scale bars in (B,C) = 50 μm. (D,E) Confocal images of prox1a:RFP+ BLECs with EPPS treatment (250 mM, e) after oAβ42 injection with high magnification revealed the internalized oAβ42 in BLECs compared to control (D). Scale bars in (D,E) = 5 μm. (F) Quantification of oAβ42 co-localization in BLECs (%) upon EPPS treatment. Statistical significance was determined by ordinary one-way ANOVA with Tukey’s test. (G,H) Confocal images of the pronephros (white dotted lines) injected with oAβ42 in control (G) and with EPPS treatment for 24 h (H). (I) Quantification of the relative ratio of the intensity between the pronephros and brain. Two-tailed unpaired t-test, p = 0.0002. Data are presented as mean ± SEM. Data are representative of at least two independent experiments. Numbers within bar bottom graphs represent n. ***, p < 0.001; ****, p < 0.0001. |