
Figure 3
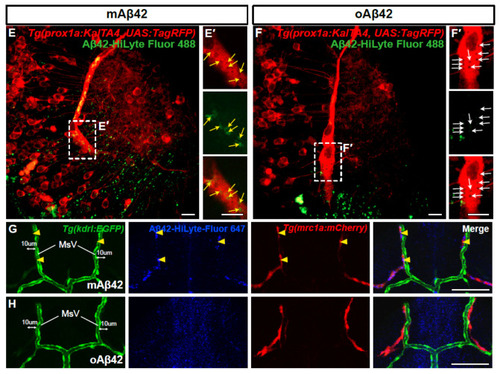
Brain lymphatic endothelial cells take up monomeric Aβ42, but not oligomeric Aβ42. (A) A schematic diagram of the larval brain with the dorsal view. Red lines in the dotted box depict the loop structure of the brain lymphatic endothelial cells (BLECs) in the optic tectum. (B) Quantification of the co-localization of Aβ42 with BLECs. Data are presented as mean ± SEM. n = 9 for mAβ42 and n = 7 for oAβ42. Statistical significance was determined by two-tailed unpaired t-test. (C) Quantification of the numbers of mrc1a+ BLECs in the optic tectum after mAβ42 or oAβ42 injection in the Tg(mrc1a:mCherry). Data are presented as mean ± SEM. n = 9 per group. (D) Quantification of the number of Aβ42 positive BLECs nearby (within 10 μm) mesencephalic vein (MsV) region showing mrc1a+ positivity. Statistical significance was determined by ordinary one-way ANOVA with Tukey’s test. n = 10 for mAβ42 and n = 8 for oAβ42. (E,F) Confocal projections of prox1a:RFP+ BLECs and Aβ42-HiLyte Fluor 488. (E′,F′) High magnification of dotted boxes in (E,F) showing endocytic vesicles of BLECs. mAβ42-injected BLECs showed robust uptake of mAβ42 into endocytic vesicles ((E′), yellow arrows) whereas oAβ42-injected did weak uptake ((F′), white arrows). Scale bars in (E–F′) = 10 μm. (G,H) Confocal fluorescence images of the brain optic tectum region with double transgenic Tg(kdrl:EGFP); Tg(mrc1a:mCherry) larvae after Aβ42 injection (HiLyte Fluor 647-Aβ42) at 3 dpf. mAβ42 fluorescence detected in the neighboring (within 10 μm) kdrl:EGFP+ cerebrovasculature was mostly co-localized with mrc1a:mCherry+ BLECs (yellow arrowheads) (G), whereas oAβ42 (H) fluorescence neighboring kdrl:EGFP+ cerebro-vasculatures was not. HB, hindbrain; OT, optic tectum; MsV, mesencephalic vein; Scale bars in (G,H) = 50 μm. ns, not significant; **** p < 0.0001. |