
|
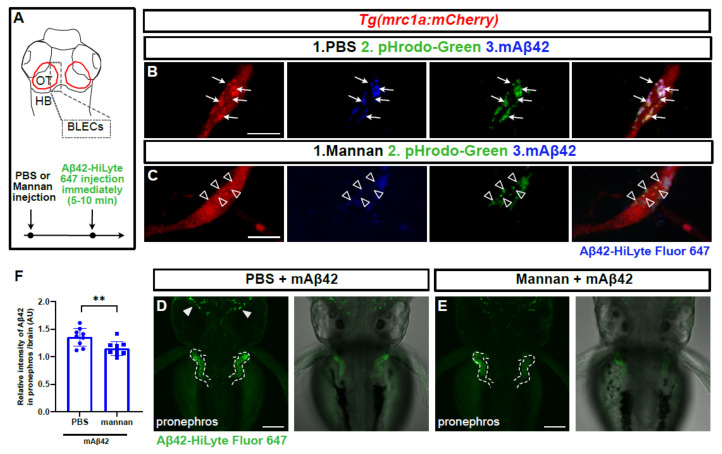
Figure 6
Mannan administration reduces uptake of mAβ42 by BLECs and peripheral transport. (A) A schematic diagram of dorsal view of the 3 dpf larval brain and the experimental setup. Dotted gray box denotes the region of interest. (B,C) Confocal images of mrc1a:mCherry+ BLECs co-injected with pHrodoGreen and mAβ42 (HiLyte Fluor 647). Arrows indicate colocalization of pHrodoGreen and mAβ42 (B). Empty arrowheads show that the mannan administration interferes with colocalization of pHrodoGreen and mAβ42. Data are representative of at least three independent experiments. Scale bars = 10 μm. (D,E) Confocal images of the zebrafish pronephros after mAβ42 injection. Dotted lines depict the pronephros structure. Arrowheads indicate the accumulation of mAβ42. Mannan treatment prior to mAβ42 injection (E) resulted in a reduced pronephric accumulation compared to PBS control (D). Scale bars = 100 μm. (F) Quantification of the relative ratio of the intensity between the pronephros and brain. Statistical significance was determined by two-tailed unpaired t-test. p = 0.0092. Data are presented as mean ± SEM. n = 9 per group. Data are representative of at least two independent experiments. **, p < 0.01.