
Figure 2
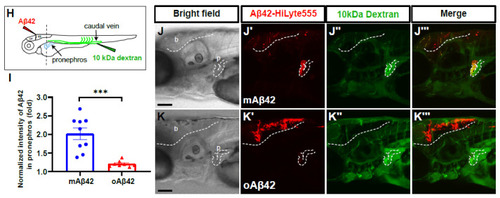
Cleared mAβ42 accumulates in the pronephros via blood flow. (A,B) mAβ42-injected larvae after propranolol (100 μM) treatment. The mAβ42 intensity in the pronephros of propranolol-treated larvae (white dotted lines) decreased (B) compared to control (A). (C,D) mAβ42-injected larvae after control morphants (C) and 200 μM tnnt2a morphants (D). (E) Quantification of heartbeats upon propranolol treatment. n = 9 for control group, n = 10 for propranolol. (F) Quantification of the mAβ42 intensity in the pronephros after propranolol treatment. n = 8 per group. (G) Quantification of the mAβ42 intensity in the pronephros of control and tnnt2a morphants. Statistical significance was determined by two tailed unpaired t-test. Data are presented as mean ± SEM. n = 9 per group. Data are representative of at least three independent experiments. (H) A schematic diagram of experimental setting of Aβ and tracer injection. mAβ42 or oAβ42 (HiLyte) was injected into ventricle and 10 kDa Dextran was injected into caudal vein. (I) Quantification of the Aβ42 fluorescence intensity in the pronephros normalized by background fluorescence. n = 9 for mAβ42, n = 8 for oAβ42. Data are representative of at least three independent experiments. (J–K‴) Confocal fluorescence images showing the brain and pronephros of zebrafish with lateral view after mAβ42 (J) or oAβ42 (K) injection at 3 dpf. Red fluorescence indicates Aβ42-HiLyte Fluor and green fluorescence show 10 kDa dextran tracer injected into caudal vein. (J′) Ventricle-injected mAβ42 was seen in the pronephros region (white dotted lines and depicted as p). (K′) Ventricle-injected oAβ42 was seen only in the brain region (b), but not detected in the pronephros. Caudal vein-injected dextran accumulated in the pronephros of both mAβ42 and oAβ42-injected larvae (J″,K″). (J‴,K‴) show merged images. b, brain; MO, morpholino; p, pronephros; Scale bars = 100 μm. ** p < 0.001; *** p < 0.0005; **** p < 0.0001. |