
|
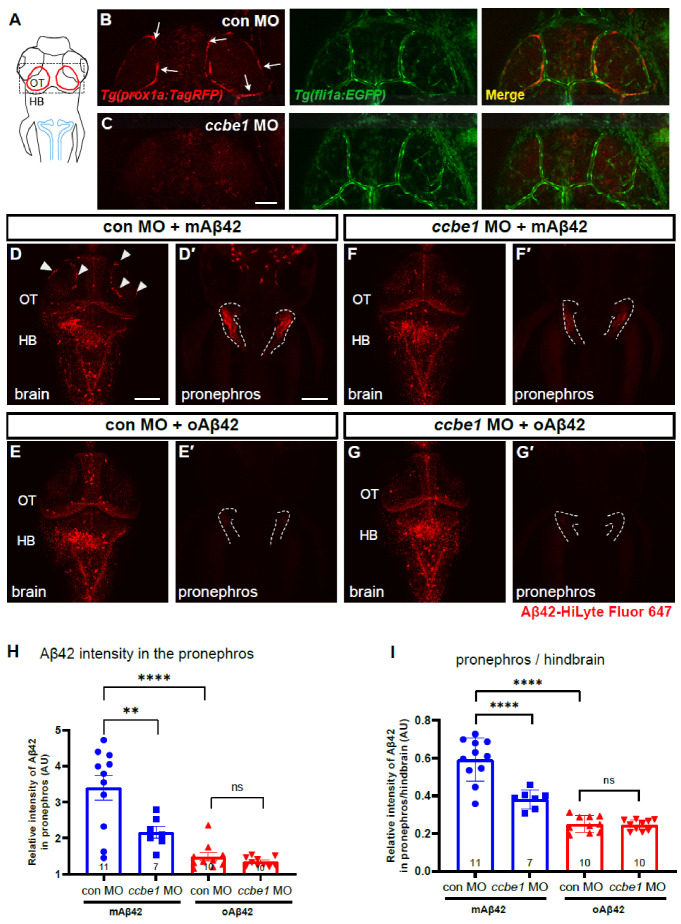
Figure 4
BLECs depletion decreases peripheral transport of mAβ42 to the pronephros. (A) A schematic diagram of zebrafish 3 dpf larvae with dorsal view. Dotted box depicts the loop structure of BLECs in the optic tectum. Blue lines depict the pronephros. (B,C) Confocal fluorescence images of the brain optic tectum region with Tg(prox1a:TagRFP); Tg(fli1a:EGFP) that labels BLECs and brain vasculatures simultaneously. Control morphant (B) and ccbe1 morphant (C) at 3 dpf with BLECs depleted in the brain with intact vasculatures. Scale bar in C = 50 μm. (D–G) Dorsal view of the larval brains of control (D,E) and ccbe1 morphants (F,G) 4 h after Aβ42 injection at 3 dpf. Red fluorescence represents Aβ42-HiLyte Fluor 647. mAβ42 is seen in BLECs (arrowheads) in the control morphants (D) but not in the ccbe1 morphants (F). (D′,E′,F′,G′) Confocal images of zebrafish pronephros (dotted lines) after Aβ42 (the same fish with brain images). The robust pronephric accumulation of Aβ42 was detectable in mAβ42-injected control (D′), but the reduced pronephric delivery of mAβ42 was observed in ccbe1 morphants (F′) compared to control. oAβ42 injection into both control and ccbe1 morphants show almost no pronephric accumulation of Aβ42 (E′,G′). Scale bars = 100 μm. (H) Quantification of Aβ42 intensity in the pronephros, normalized by the intensity of non-fluorescent background. (I) Quantification of the relative intensity ratio between the pronephros and hindbrain. Statistical significance was determined by ordinary one-way ANOVA with Tukey’s test. HB, hindbrain; MO, morpholino; OT, optic tectum; n, independent biological samples or animals. Numbers within bar bottom graphs represent n. **, p < 0.01; ****, p < 0.0001; ns, not significant.