
|
Figure 5
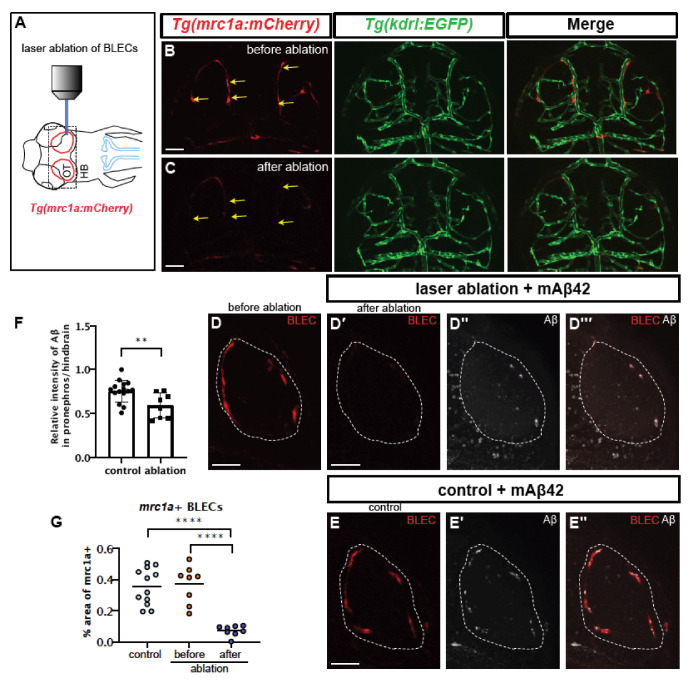
Selective ablation of BLECs decreased internalization of mAβ42 and pronephric accumulation. (A) A schematic diagram of the experimental setting. BLEC-specific ablation using the confocal laser. (B,C) Confocal images of BLECs in the double transgenic Tg(mrc1a:mCherry); Tg(kdrl:EGFP) at 3 dpf before laser irradiation (B) and after ablation (C). Yellow arrows indicate the ablated BLECs. Scale bars = 50 μm. (D) Confocal images of mrc1a+ BLECs in the loop of the optic before ablation (D) and after ablation and mAβ42 injection (D′–D‴). (D′) shows red channel, (D″) shows mAβ42 (HiLyte647, white) and (D‴) is a merged image. Dotted lines denote the loop of BLECs. (E) Confocal images of mrc1a+ BLECs with mAβ42 injection (non-ablated control). Scale bars = 50 μm. (E′) shows mAβ42 (HiLyte647, white) and (E’’) shows merged images of BLECs and mAβ42. (F) Quantification of the relative intensity ratio between the pronephros and hindbrain. Data are presented as mean ± SEM. Statistical significance was determined by two-tailed unpaired t-test. n = 15 for non-ablated control, n = 8 for ablated. p = 0.0092. (G) Quantification of area fraction (%) occupied by mrc1a+ BLECs. Data are presented as mean ± SEM. Statistical significance was determined by ordinary one-way ANOVA with Tukey’s test. **, p < 0.01; ****, p < 0.0001.