
|
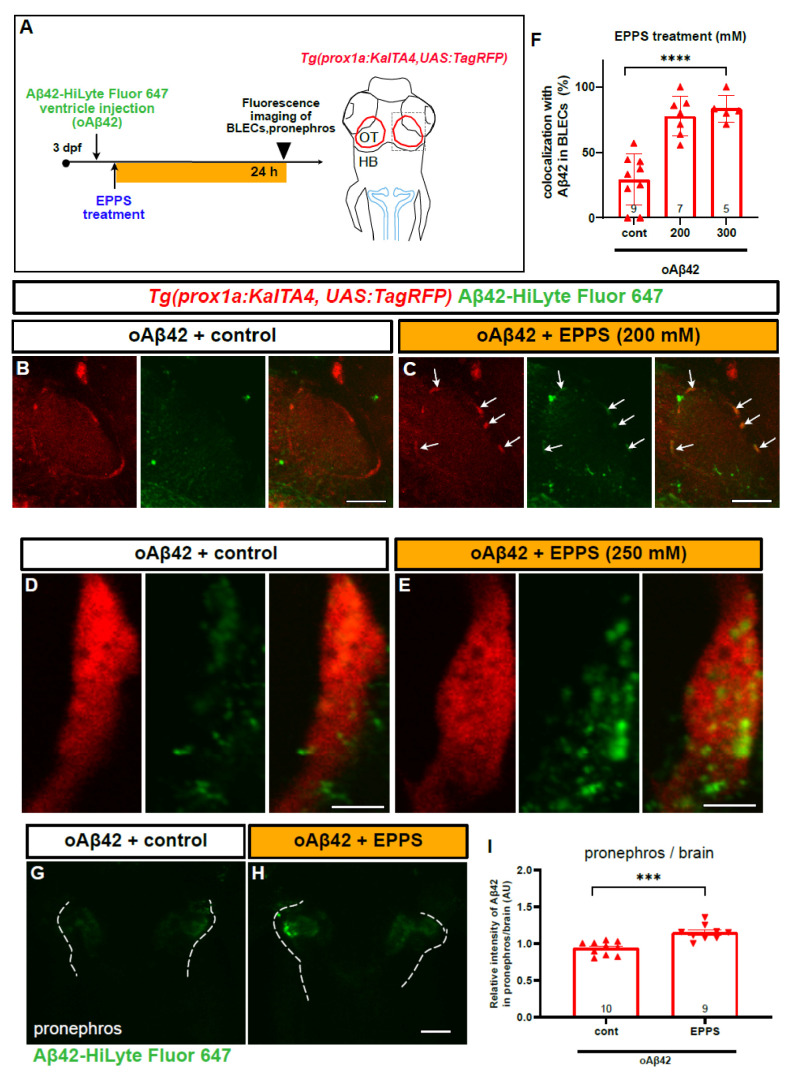
Figure 7
EPPS treatment enhances the BLEC localization and pronephric transport of oAβ42. (A) A schematic diagram of EPPS treatment after oAβ42 (HiLyte-Fluor 647) injection. Gray dotted box depicts the region of interest and blue lines indicate the pronephros. (B–E) Confocal images of prox1a:RFP+ BLECs in the loop of the optic tectum of oAβ42-injected larval brain with control (B,D) and EPPS treatment (C,E). (B,C) Co-localization of BLECs with oAβ42 increased upon EPPS treatment (arrows) in c compared to control (B). Scale bars in (B,C) = 50 μm. (D,E) Confocal images of prox1a:RFP+ BLECs with EPPS treatment (250 mM, e) after oAβ42 injection with high magnification revealed the internalized oAβ42 in BLECs compared to control (D). Scale bars in (D,E) = 5 μm. (F) Quantification of oAβ42 co-localization in BLECs (%) upon EPPS treatment. Statistical significance was determined by ordinary one-way ANOVA with Tukey’s test. (G,H) Confocal images of the pronephros (white dotted lines) injected with oAβ42 in control (G) and with EPPS treatment for 24 h (H). (I) Quantification of the relative ratio of the intensity between the pronephros and brain. Two-tailed unpaired t-test, p = 0.0002. Data are presented as mean ± SEM. Data are representative of at least two independent experiments. Numbers within bar bottom graphs represent n. ***, p < 0.001; ****, p < 0.0001.