
- Title
-
Autophagy coordinates chondrocyte development and early joint formation in zebrafish
- Authors
- Moss, J.J., Wirth, M., Tooze, S.A., Lane, J.D., Hammond, C.L.
- Source
- Full text @ FASEB J.
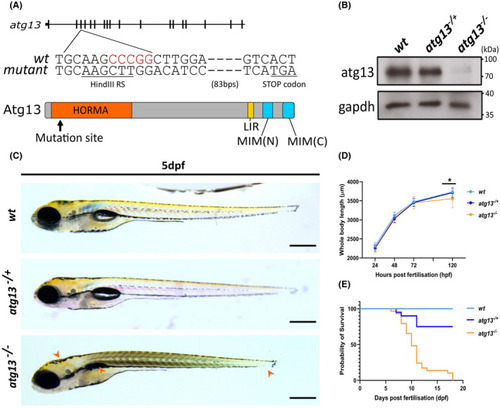
Generation of atg13 knock out zebrafish line. (A) Schematic showing location of 5 bp deletion in atg13 knockout line and generation of premature STOP codon, with black lines representing exons. Key domains within atg13 highlighted; LIR, Lc3‐interacting region; MIM, Microtubule interacting motif. (B) Immunoblot showing loss of atg13 expression in atg13 homozygous mutant. (C) Lateral widefield images of atg13 zebrafish larvae at 5 dpf. Orange arrowheads indicate phenotypic differences in development between wt and atg13 mutants (from left to right: bent body axis, uninflated swim bladder and shorter body length). Scale bar = 500 µm. (D) Graph showing whole body length of atg13 larvae from 1–5 dpf. Student's t‐test performed at 5 dpf between wt and atg13 mutant, *p = .0013. (E) Kaplan–Meier graph showing survival of larvae up to 20 dpf PHENOTYPE:
|
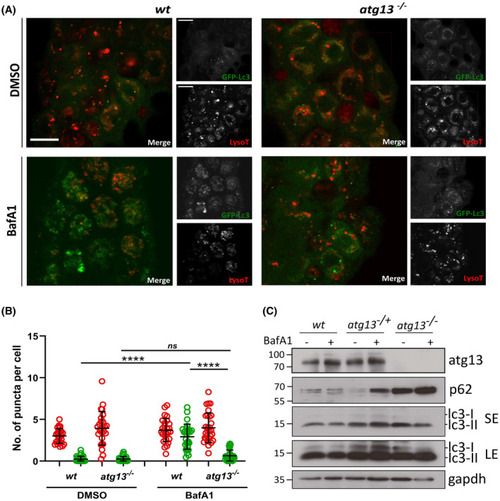
atg13 mutants show reduced autophagy flux. (A) Representative single confocal z‐slices of epidermal cells taken from LysoTracker stained Tg(cmv:gfp‐map1lc3;atg13) wt and mutant larvae, at 4 dpf following treatment with DMSO or 100 nM Bafilomycin for 3 h. Scale bars = 10 µm. (B) Quantification of number of lysosomal (red) and GFP‐Lc3 (green) puncta per cell. Two‐way ANOVA performed for each; ****p < .0001. (C) Representative immunoblot of atg13 wt, heterozygous and mutant larvae at 5 dpf following treatment with DMSO or 100 nM Bafilomycin for 3 h. LE, long exposure; SE, short exposure. Molecular weight markers indicated on right hand side of immunoblots |
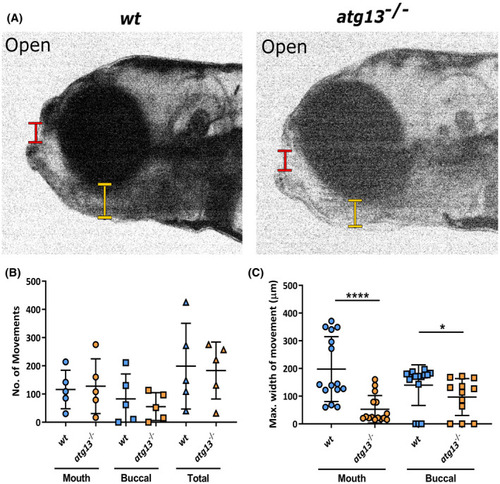
atg13 mutation reduces jaw function. (A) Stills from videos of larval jaw movements taken at 5 dpf of wt and atg13‐mutant fish. Red and yellow lines indicate where mouth and buccal width measurements taken from, respectively. Quantification of number (B) and displacement (C) of jaw movements at the mouth and buccal joint. n = 5 for each genotype; three widest jaw openings taken per larvae. Student's unpaired t test performed for (C), ****p < .0001, *p = .0129 PHENOTYPE:
|
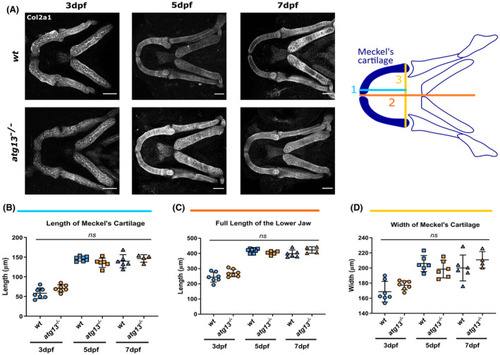
Loss of atg13 does not affect size of lower jaw in development. (A) Left, representative confocal z‐stack projections of the lower jaw at 3, 5, and 7 dpf in wt and atg13‐mutant larvae, immunostained for collagen Type II (Col2a1). Scale bar = 50 µm. Right, schematic showing where 3 measurements taken within lower jaw of larvae. (B–D) Quantification of three measurements; (B) length of Merkel's cartilage, (C) length of lower jaw, (D) width of Merkel's cartilage. n = 7 for 3 dpf, n = 6 for 5 dpf and n = 6 and 4 at 7 dpf for wt and atg13 mutant, respectively. Student's unpaired t test performed for each age, ns p > .05 EXPRESSION / LABELING:
PHENOTYPE:
|
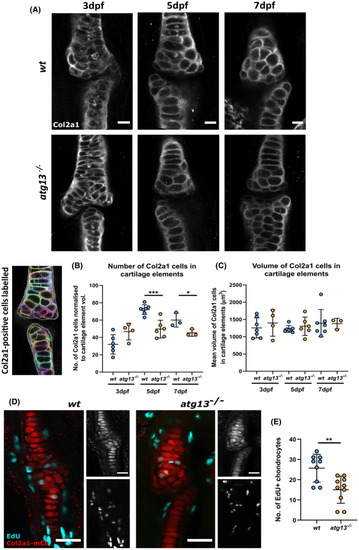
atg13‐mutant fish show decreased number of chondrocytes and reduced proliferation at joint site. (A) Representative confocal slices of lower jaw joint at 3, 5 and 7 dpf in wt and atg13‐mutant fish, immunohistochemically labeled for Col2a1. Scale bars = 20 µm. (B) Left, example slice from confocal image showing Col2a1‐positive cells outlined by modular image analysis program run in Fiji. Right, quantification of Col2a1‐positive cell number normalized to cartilage element volume, (C) and volume of Col2a1‐positive cells within cartilage element for wt and atg13 mutants. Each data point = one larvae. Student's unpaired t test performed where ***p = .0004, *p = .0463. (D) Confocal max projections of larval jaw joint in Tg(atg13; Col2a1aBAC:mcherry) wt and atg13 mutants at 6 dpf following 24‐h treatment with EdU Click‐iT, EdU (cyan) and mCh‐Col2a1 (red). Scale bars = 25 and 20 µm for insets. (E) Quantification of number of EdU positive chondrocytes within jaw joint region (determined as region at 5× zoom on 20× objective, when joint in middle of image plane). EdU positive chondrocytes colocalized to Col2a1 staining and counted by going through z‐stack. Student's unpaired t test performed, **p = .0032 EXPRESSION / LABELING:
PHENOTYPE:
|
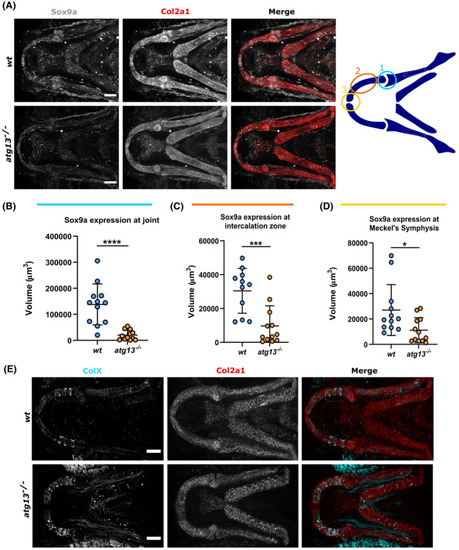
atg13 mutation affects expression and production of key factors in cartilage development. (A) Left, confocal max projections of lower jaw at 5 dpf in wt and atg13‐mutant fish, immunostained for Sox9a (grey) and Col2a1 (red). Scale bars = 50 µm. Right, schematic showing regions of interest selected within lower jaw in modular image analysis program (SoxQuant). Colours correspond to graphs below. (B–D) Quantification of Sox9a expression measured as volume of Sox9a within Col2a1 positive cells from confocal z‐stack. Student's unpaired t test performed where ****p < .0001, ***p = .0007, *p = .0173; n = 12 for both. (E) Confocal max projections of the lower jaw at 7 dpf in Tg(atg13; Col2a1aBAC:mcherry) wt and atg13‐mutant larvae, immunostained for collagen Type X (ColX) (cyan) and mCherry (for Col2a1, red). Scale bars = 50 µm |
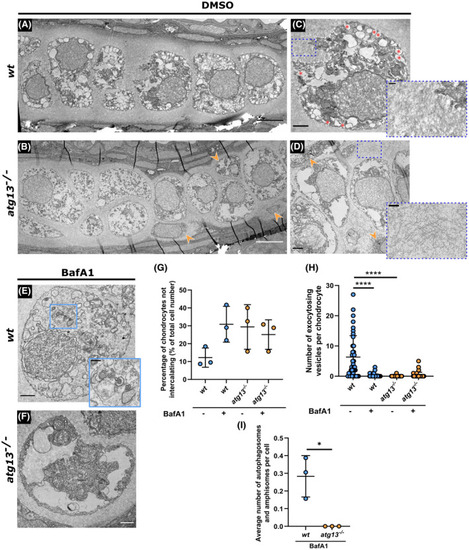
Ultrastructure and organization of chondrocytes affected in atg13 mutants. (A–D) Electron microscopy of ethmoid plate in wt and atg13‐mutant fish at 5 dpf following DMSO or (E and F) BafA1 treatment for 3 h. (B and D) Orange arrow heads highlight areas of non‐uniformity and non‐intercalating chondrocytes in atg13‐mutant cartilage. (C) Red asterisks show vesicles fusing with outer membrane in wt, not present in atg13 mutant. Blue dotted boxes and inset show differences in ECM organization and density between wt and atg13 mutants. (E and F) BafA1 treatment increases number of vesicles in both wt and atg13 mutants and ablates vesicle‐membrane fusion events. Blue box and inset in (E) shows autophagosome in BafA1 treated wt chondrocyte, not present in atg13 mutants. Scale bars A, B = 5 µm; C–F = 1.5 µm; C’–E’ = 0.5 µm. (G) Number of chondrocytes on periphery of cartilage and not aligning down central line of stack. Calculated as percentage of total cell number along ethmoid plate in one section. N = 38 chondrocytes total from 3 larvae, per condition and genotype. (H) Number of vesicles fusing with outer cell membrane quantified per cell following DMSO or BafA1 treatment. Two‐way ANOVA performed for each; ****p < .0001. (I) Average number of autophagosomal structures per chondrocyte in bafilomycin A1 treated fish, calculated as average of all chondrocytes per individual fish. Student's unpaired t‐test performed; *p = .0138 PHENOTYPE:
|