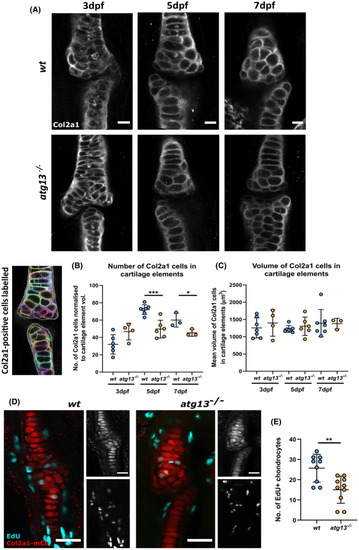
atg13‐mutant fish show decreased number of chondrocytes and reduced proliferation at joint site. (A) Representative confocal slices of lower jaw joint at 3, 5 and 7 dpf in wt and atg13‐mutant fish, immunohistochemically labeled for Col2a1. Scale bars = 20 µm. (B) Left, example slice from confocal image showing Col2a1‐positive cells outlined by modular image analysis program run in Fiji. Right, quantification of Col2a1‐positive cell number normalized to cartilage element volume, (C) and volume of Col2a1‐positive cells within cartilage element for wt and atg13 mutants. Each data point = one larvae. Student's unpaired t test performed where ***p = .0004, *p = .0463. (D) Confocal max projections of larval jaw joint in Tg(atg13; Col2a1aBAC:mcherry) wt and atg13 mutants at 6 dpf following 24‐h treatment with EdU Click‐iT, EdU (cyan) and mCh‐Col2a1 (red). Scale bars = 25 and 20 µm for insets. (E) Quantification of number of EdU positive chondrocytes within jaw joint region (determined as region at 5× zoom on 20× objective, when joint in middle of image plane). EdU positive chondrocytes colocalized to Col2a1 staining and counted by going through z‐stack. Student's unpaired t test performed, **p = .0032
|
