
Fig. 1
- ID
- ZDB-FIG-221209-20
- Publication
- Moss et al., 2021 - Autophagy coordinates chondrocyte development and early joint formation in zebrafish
- Other Figures
- All Figure Page
- Back to All Figure Page
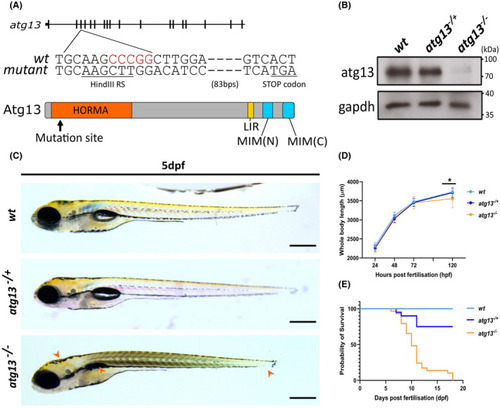
Generation of atg13 knock out zebrafish line. (A) Schematic showing location of 5 bp deletion in atg13 knockout line and generation of premature STOP codon, with black lines representing exons. Key domains within atg13 highlighted; LIR, Lc3‐interacting region; MIM, Microtubule interacting motif. (B) Immunoblot showing loss of atg13 expression in atg13 homozygous mutant. (C) Lateral widefield images of atg13 zebrafish larvae at 5 dpf. Orange arrowheads indicate phenotypic differences in development between wt and atg13 mutants (from left to right: bent body axis, uninflated swim bladder and shorter body length). Scale bar = 500 µm. (D) Graph showing whole body length of atg13 larvae from 1–5 dpf. Student's t‐test performed at 5 dpf between wt and atg13 mutant, *p = .0013. (E) Kaplan–Meier graph showing survival of larvae up to 20 dpf |
| Fish: | |
|---|---|
| Observed In: | |
| Stage Range: | Prim-5 to Days 14-20 |