
Fig. 2
- ID
- ZDB-IMAGE-221209-17
- Antibodies
- Publication
- Moss et al., 2021 - Autophagy coordinates chondrocyte development and early joint formation in zebrafish
- All Figures
- Figures for Moss et al., 2021
|
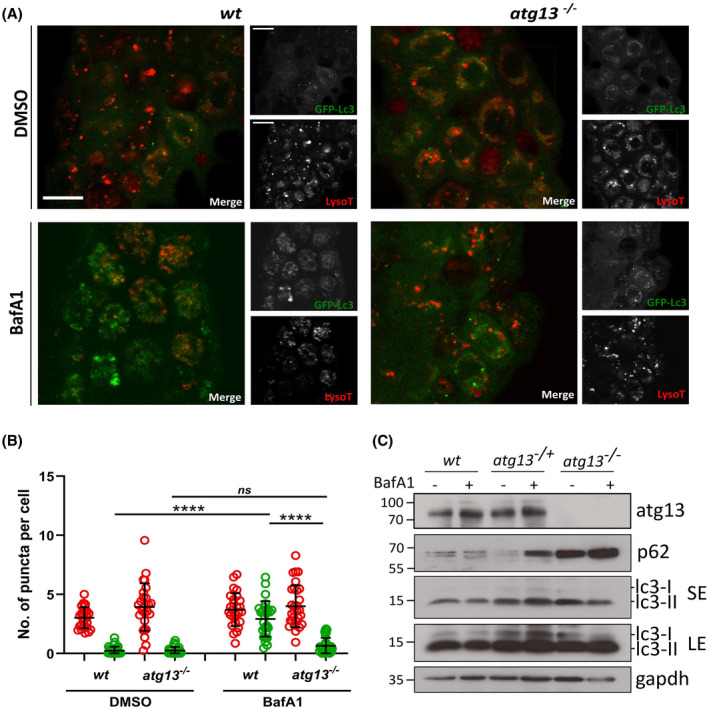
Fig. 2
atg13 mutants show reduced autophagy flux. (A) Representative single confocal z‐slices of epidermal cells taken from LysoTracker stained Tg(cmv:gfp‐map1lc3;atg13) wt and mutant larvae, at 4 dpf following treatment with DMSO or 100 nM Bafilomycin for 3 h. Scale bars = 10 µm. (B) Quantification of number of lysosomal (red) and GFP‐Lc3 (green) puncta per cell. Two‐way ANOVA performed for each; ****p < .0001. (C) Representative immunoblot of atg13 wt, heterozygous and mutant larvae at 5 dpf following treatment with DMSO or 100 nM Bafilomycin for 3 h. LE, long exposure; SE, short exposure. Molecular weight markers indicated on right hand side of immunoblots