
Fig. 7
- ID
- ZDB-FIG-221209-26
- Publication
- Moss et al., 2021 - Autophagy coordinates chondrocyte development and early joint formation in zebrafish
- Other Figures
- All Figure Page
- Back to All Figure Page
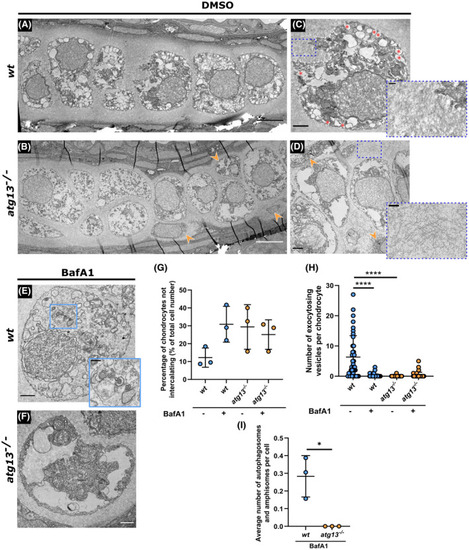
Ultrastructure and organization of chondrocytes affected in atg13 mutants. (A–D) Electron microscopy of ethmoid plate in wt and atg13‐mutant fish at 5 dpf following DMSO or (E and F) BafA1 treatment for 3 h. (B and D) Orange arrow heads highlight areas of non‐uniformity and non‐intercalating chondrocytes in atg13‐mutant cartilage. (C) Red asterisks show vesicles fusing with outer membrane in wt, not present in atg13 mutant. Blue dotted boxes and inset show differences in ECM organization and density between wt and atg13 mutants. (E and F) BafA1 treatment increases number of vesicles in both wt and atg13 mutants and ablates vesicle‐membrane fusion events. Blue box and inset in (E) shows autophagosome in BafA1 treated wt chondrocyte, not present in atg13 mutants. Scale bars A, B = 5 µm; C–F = 1.5 µm; C’–E’ = 0.5 µm. (G) Number of chondrocytes on periphery of cartilage and not aligning down central line of stack. Calculated as percentage of total cell number along ethmoid plate in one section. N = 38 chondrocytes total from 3 larvae, per condition and genotype. (H) Number of vesicles fusing with outer cell membrane quantified per cell following DMSO or BafA1 treatment. Two‐way ANOVA performed for each; ****p < .0001. (I) Average number of autophagosomal structures per chondrocyte in bafilomycin A1 treated fish, calculated as average of all chondrocytes per individual fish. Student's unpaired t‐test performed; *p = .0138 |
| Fish: | |
|---|---|
| Condition: | |
| Observed In: | |
| Stage: | Day 5 |