
IMAGE
Fig. 3
- ID
- ZDB-IMAGE-221209-18
- Publication
- Moss et al., 2021 - Autophagy coordinates chondrocyte development and early joint formation in zebrafish
- All Figures
- Figures for Moss et al., 2021
Image
|
Figure Caption
Fig. 3
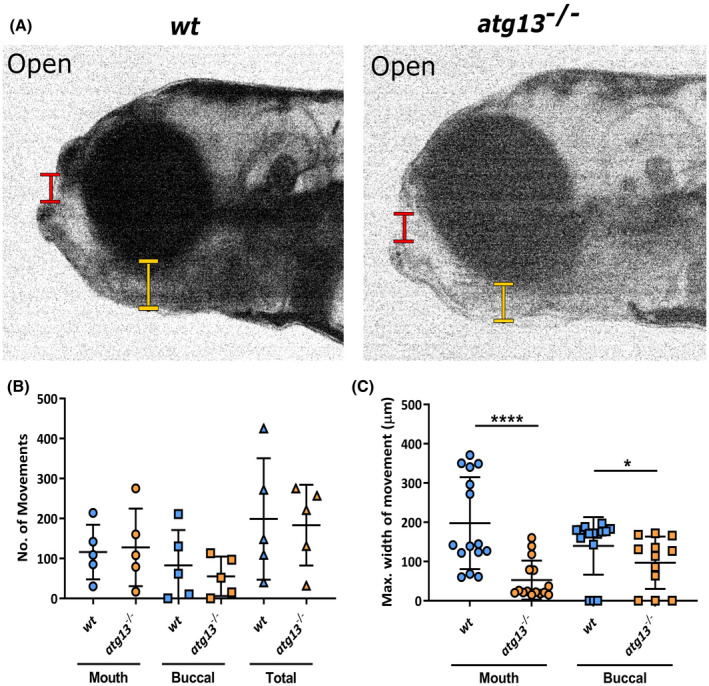
atg13 mutation reduces jaw function. (A) Stills from videos of larval jaw movements taken at 5 dpf of wt and atg13‐mutant fish. Red and yellow lines indicate where mouth and buccal width measurements taken from, respectively. Quantification of number (B) and displacement (C) of jaw movements at the mouth and buccal joint. n = 5 for each genotype; three widest jaw openings taken per larvae. Student's unpaired t test performed for (C), ****p < .0001, *p = .0129
Figure Data
Acknowledgments
This image is the copyrighted work of the attributed author or publisher, and
ZFIN has permission only to display this image to its users.
Additional permissions should be obtained from the applicable author or publisher of the image.
Full text @ FASEB J.