FIGURE SUMMARY
Title

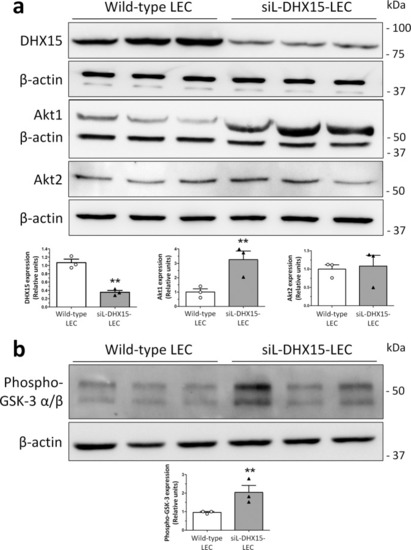
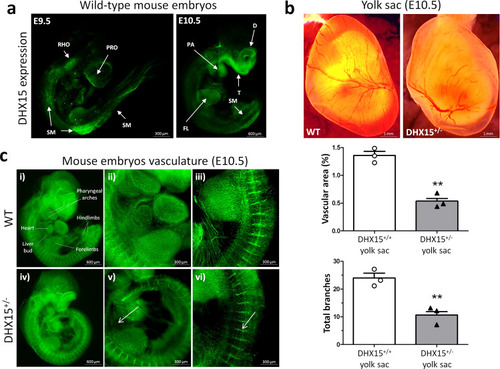
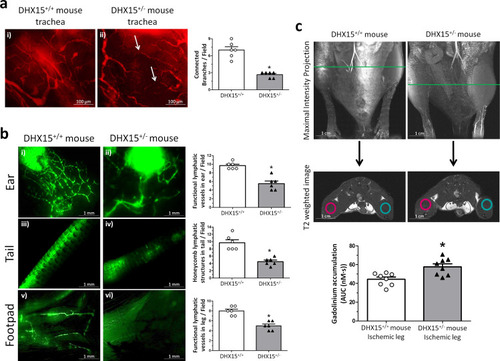
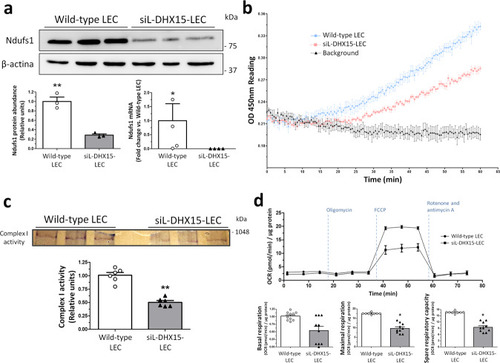
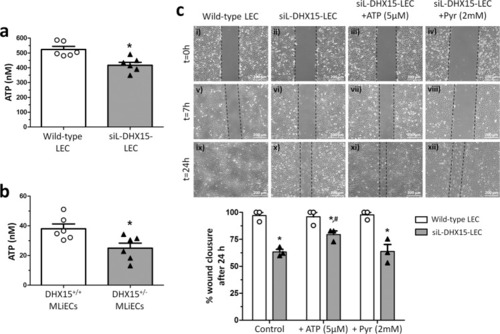
The loss of DHX15 impairs endothelial energy metabolism, lymphatic drainage and tumor metastasis in mice

Authors
Ribera, J., Portolés, I., Córdoba-Jover, B., Rodríguez-Vita, J., Casals, G., González-de la Presa, B., Graupera, M., Solsona-Vilarrasa, E., Garcia-Ruiz, C., Fernández-Checa, J.C., Soria, G., Tudela, R., Esteve-Codina, A., Espadas, G., Sabidó, E., Jiménez, W., C Sessa, W., Morales-Ruiz, M.
Source
Full text @ Commun Biol

Characterization of the Akt and DHX15 signaling crosstalk in endothelial cells.

a The expression of DHX15, Akt1, and Akt2 proteins was evaluated by western blot using cell lysates from wild-type and siL-DHX15-LECs. β-actin was used as a loading control. The densitometric analysis of the protein expression is shown on the bar graph. **p < 0.01 vs. wild-type LEC (n = 3 biologically independent samples for each condition). b The activity of Akt was determined in non-silenced and DHX15-silenced endothelial cells in a kinase reaction using recombinant GSK-3 as substrate. The levels of GSK-3α/β phosphorylation were analyzed by western blot using a phospho-GSK-3 specific antibody. β-actin was used as a loading control. The densitometric analysis of the protein expression is shown on the bar graph. **p < 0.01 vs. wild-type LEC (n = 3 biologically independent samples for each condition). All statistical analyses were performed using unpaired two-tailed Student’s t-test. All bar graphs are presented as mean ± SEM.

Embryonic characterization of <italic>DHX15</italic> gene deficiency and expression in the gene-edited mouse and zebrafish models.

a Representative immunostaining of the DHX15 expression (green) from mouse embryos at E9.5 and E10.5 of embryonic development (n = 3 animals for each embryonic day). Maximal projection is shown. Original magnification: ×20 for E9.5 and ×10 for E10.5. b Representative bright-field images of the yolk sac vasculature from mouse embryos at E10.5 of embryonic development. Maximal projection is shown for each genotype. Original magnification: ×8. The vascular density quantification is shown on the histograms expressed as the percentage of vascular area (upper graph) and total branches (lower graph). Bars represent the mean ± SEM, **p < 0.01 vs. wild-type, unpaired two-tailed Student’s t-test (n = 3 animals for each condition). c Representative immunostaining of the vasculature with endomucin (green) from mouse embryos at the stage E10.5 of embryonic development. The white arrows denote areas of decreased vascular density (n = 6 animals for each condition). Maximal projection and 3D rendering from the microscope are shown for each genotype. Original magnification: ×20 and ×40.

Characterization of embryonic vascular anomalies associated with <italic>DHX15</italic> gene deficient in zebrafish.

a Representative vascular images of DHX15+/+ and DHX15−/− larvae at 5 day post fertilization (dpf) revealing a reduced formation of the parachordal line (arrows). Asterisks denote the absence of these vascular structures in DHX15−/− animals. Quantifications of cardinal vein diameter, intersegmental vessels (ISV), and number of parachordal lymphangioblast strings (PLS) are shown in the graphs. **p < 0.01 vs. wild-type zebrafish, unpaired two-tailed Student’s t-test (n = 10 and n = 18 for the DHX15+/+ and DHX15−/− conditions, respectively). Arbitrary units: a.u. b RNA extraction of zebrafish embryos at 4 dpf from either wild-type or DHX15 knockout larvae was performed. mRNA expression was analyzed by RT-qPCR. The graph shows the different expression levels of the VEGF-C gene in the DHX15+/+ and DHX15−/− conditions. mRNA levels are shown as fold change relative to HPRT mRNA levels. *p < 0.05 vs. wild-type unpaired two-tailed Student’s t-test (n = 4 biologically independent samples for each condition). c Survival assessment assay. The graph shows the larvae survival rate through the first 10 dpf according to their different genotype (n = 15 zebrafish larvae for each condition). d Representative images comparing wild-type and DHX15−/− larvae at 7 dpf where morphological defects including encephalic and cardiac edema, scoliosis, and impaired neural/eye growth are evident. All bar graphs are presented as mean ± SEM.

DHX15<sup>+/-</sup> mice showed cardiovascular and lymphatic vasculature alterations.

a Representative immunofluorescent images (red CD31 staining) of mouse trachea vessels. White arrowhead evidences lack of connectivity between large vessels. Vascular density quantification is shown on the histogram. *p < 0.05 vs. wild-type (n = 5 animals for each contiditon). b Lymphatic drainage of 2000 KDa FITC-dextran analyzed by lymphangiography. Fluorescent dye was injected intradermally in the ear (panels i and ii), in the interstitium of the tail-tip (panels iii and iv) and in the footpad (panels v and vi) to assess lymphatic uptake. Lymphatic uptake quantification is shown on the histograms. *p < 0.05 vs. wild-type (n = 5 animals for each contidion). c Representative magnetic resonance images (MRI) for both strains of mice. First row shows the maximal intensity projection of the time of flight (TOF) angiography. The green line indicates the position of the coronal image (second row: T2-weighted image) where the regions of interest (ROIs) for the analysis of the dynamic contrast enhanced-MRI experiment were positioned. In blue, ROIs for the control leg, in red, ROIs for the ischemic leg. The lower graph shows the area under the concentration curve (AUC) calculated for the ischemic leg in WT and DHX15+/− mice. *p < 0.05 vs. wild-type mouse (n = 8 animals for each condition). All statistical analyses were performed using unpaired two-tailed Student’s t-test. All bar graphs are presented as mean ± SEM.

siL-DHX15-LEC showed impaired mitochondrial respiratory chain activity.

a Protein and gene expression of NDUFS1 was analyzed. Protein was evaluated by western blot using cell lysates from wild-type and siL-DHX15-LEC. β-actin was used as a loading control. The densitometric analysis of the protein expression are shown on the bottom left bar graph. **p < 0.01 (n = 3 biologically independent samples for each condition). mRNA expression was analyzed by RT-qPCR. mRNA levels are illustrated as fold change relative to HPRT mRNA levels. Bottom right graph. *p < 0.05 (n = 4 biologically independent samples for each condition). b Complex I activity was assessed using a commercial colorimetric enzymatic reaction reagent for the mitochondrial respiratory complex I in wild-type and siL-DHX15-LEC. Seven hundred µg of total protein was used in each experimental condition (n = 3 biologically independent samples for each condition). Wild-type-LEC: upper line, siL-DHX15-LEC: middle line, background: bottom line. cIn-gel activity staining on clear-native page (CN-PAGE) of the respiratory complex I from wild-type and siL-DHX15-LEC’s mitochondria. The quantification of the relative band intensities of complex I activity is shown in the graph below. **p < 0.01 vs. wild-type LEC (n = 6 biologically independent samples for each condition). d Wild-type and siL-DHX15-LEC were evaluated for basal, coupled and maximal respiration in a mito-stress assay using a Seahorse XFe24 analyzer (n = 10 independent Seahorse wells for each condition). OCR is normalized to µg of total protein. *p < 0.05 vs. wild-type LEC. All statistical analyses were performed using unpaired two-tailed Student’s t-test. All data are presented as mean ± SEM.

siL-DHX15-LEC presented less cell migration.

a ATP production was evaluated by a luminescence assay in wild-type and siL-DHX15-LEC. Bars represent the mean ± SEM, *p < 0.05 vs. wild-type LEC (n = 6 biologically independent samples for each condition). b ATP production was evaluated by a luminescence assay in MLiEC isolated from wild-type and DHX15+/− mice. Bars represent the mean ± SEM, *p < 0.05 vs. wild-type LEC (n = 3 biologically independent samples for each condition). c Cell migration was quantified after performing a scratch wound in confluent non-silenced and silenced LECs cells that were cultured in six-well plates. Then images of wound healing were acquired after 0, 7, and 24 h (n = 6 independent experiments). Graph shows the quantification of the wound closure after 24 h as percentage of migration. Bars represent the mean ± SEM, *p < 0.05 vs. respective wild-types and #p < 0.05 vs. siL-DHX15-LECs without ATP and the pyruvate condition (Pyr). For a and b statistical analyses were performed using unpaired two-tailed Student’s t-test; for c statistical analysis was performed using one-way ANOVA with Tukey’s post hoc test for multiple comparisons. All bar graphs are presented as mean ± SEM.

Tumor growth and metastases in DHX15<sup>+/−</sup> mouse.

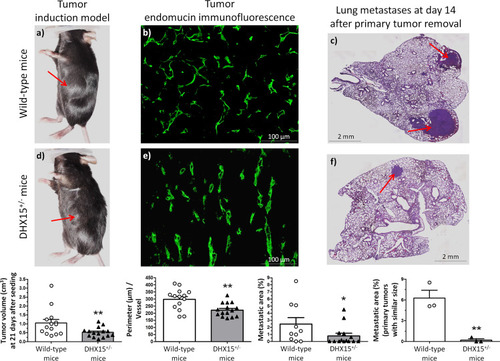
Macroscopic images of tumor size in wild-type (a) and DHX15+/- mice (d) three weeks after mouse Lewis lung cancer cells (LLC1) implantation. The arrows indicate the primary tumor. The quantification of tumor volume (cm3) is shown on the lower graph. **p < 0.01 vs. wild-type mice (n = 15 animals for each condition). Middle panels show endomucin immunostaining of intratumoral blood vessels in wild-type (b) and DHX15+/− mice (e). The quantification of the total vascular perimeter of all the intratumoral blood vessels that were positive for endomucin immunostaining was performed with the software Image J. Then, the total vascular perimeter per field was divided by the total number of endomucin+ vessels per field. The statistical comparison between experimental groups was made considering the result of this index (Perimeter/Vessel). **p < 0.01 vs. wild-type mice (n = 15 biologically independent samples for each condition; original magnification: ×200). Right panels show representative lung sections of lung metastatic area after haematoxylin-eosin staining (H&E) in wild-type (c) and DHX15+/− mice (f). The arrows indicate the metastatic areas. Quantifications of the percentage of lung metastases are shown in the graphs below. In the graph on the left: all tumors. *p < 0.05 vs. wild-type mice (n = 15 biologically independent samples for each condition). In the graph on the right: primary tumors with similar size. **p < 0.01 vs. wild-type mice (n = 3 biologically independent samples for each condition). Original magnification: ×10. All statistical analyses were performed using unpaired two-tailed Student’s t-test. All bar graphs are presented as mean ± SEM.

ZFIN is incorporating published figure images and captions as part of an ongoing project. Figures from some publications have not yet been curated, or are not available for display because of copyright restrictions.

EXPRESSION / LABELING:
Genes:
Fish:
Anatomical Terms:
Stage Range: Prim-5 to Protruding-mouth
Acknowledgments
This image is the copyrighted work of the attributed author or publisher, and ZFIN has permission only to display this image to its users. Additional permissions should be obtained from the applicable author or publisher of the image. Full text @ Commun Biol