|
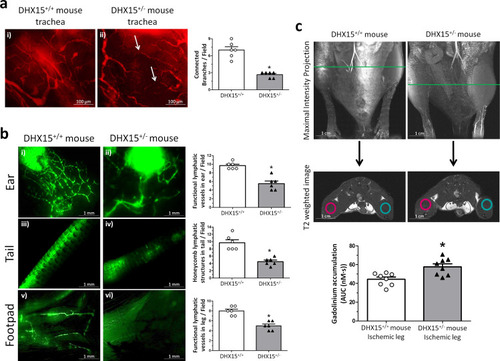
DHX15<sup>+/-</sup> mice showed cardiovascular and lymphatic vasculature alterations.a Representative immunofluorescent images (red CD31 staining) of mouse trachea vessels. White arrowhead evidences lack of connectivity between large vessels. Vascular density quantification is shown on the histogram. *p < 0.05 vs. wild-type (n = 5 animals for each contiditon). b Lymphatic drainage of 2000 KDa FITC-dextran analyzed by lymphangiography. Fluorescent dye was injected intradermally in the ear (panels i and ii), in the interstitium of the tail-tip (panels iii and iv) and in the footpad (panels v and vi) to assess lymphatic uptake. Lymphatic uptake quantification is shown on the histograms. *p < 0.05 vs. wild-type (n = 5 animals for each contidion). c Representative magnetic resonance images (MRI) for both strains of mice. First row shows the maximal intensity projection of the time of flight (TOF) angiography. The green line indicates the position of the coronal image (second row: T2-weighted image) where the regions of interest (ROIs) for the analysis of the dynamic contrast enhanced-MRI experiment were positioned. In blue, ROIs for the control leg, in red, ROIs for the ischemic leg. The lower graph shows the area under the concentration curve (AUC) calculated for the ischemic leg in WT and DHX15+/− mice. *p < 0.05 vs. wild-type mouse (n = 8 animals for each condition). All statistical analyses were performed using unpaired two-tailed Student’s t-test. All bar graphs are presented as mean ± SEM.
|