
Fig. 2
- ID
- ZDB-IMAGE-211025-177
- Publication
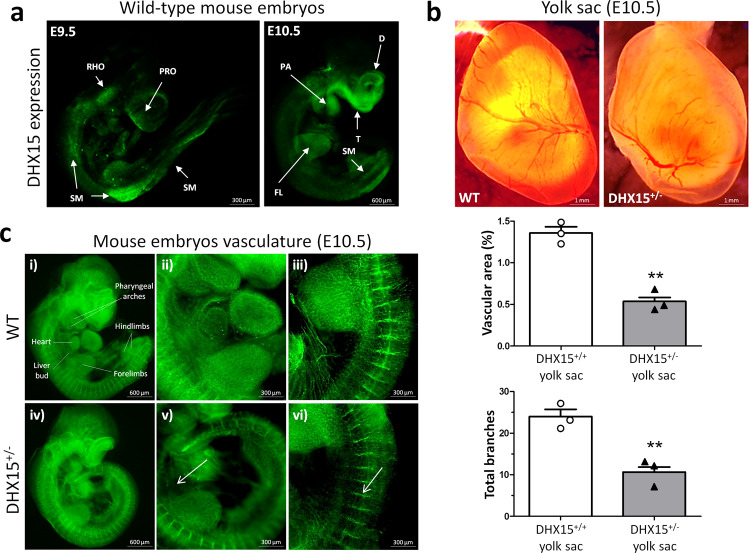
- Ribera et al., 2021 - The loss of DHX15 impairs endothelial energy metabolism, lymphatic drainage and tumor metastasis in mice
- All Figures
- Figures for Ribera et al., 2021
|
Fig. 2