|
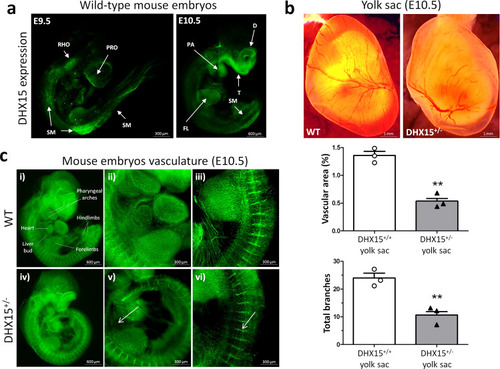
Embryonic characterization of <italic>DHX15</italic> gene deficiency and expression in the gene-edited mouse and zebrafish models.a Representative immunostaining of the DHX15 expression (green) from mouse embryos at E9.5 and E10.5 of embryonic development (n = 3 animals for each embryonic day). Maximal projection is shown. Original magnification: ×20 for E9.5 and ×10 for E10.5. b Representative bright-field images of the yolk sac vasculature from mouse embryos at E10.5 of embryonic development. Maximal projection is shown for each genotype. Original magnification: ×8. The vascular density quantification is shown on the histograms expressed as the percentage of vascular area (upper graph) and total branches (lower graph). Bars represent the mean ± SEM, **p < 0.01 vs. wild-type, unpaired two-tailed Student’s t-test (n = 3 animals for each condition). c Representative immunostaining of the vasculature with endomucin (green) from mouse embryos at the stage E10.5 of embryonic development. The white arrows denote areas of decreased vascular density (n = 6 animals for each condition). Maximal projection and 3D rendering from the microscope are shown for each genotype. Original magnification: ×20 and ×40.
|