|
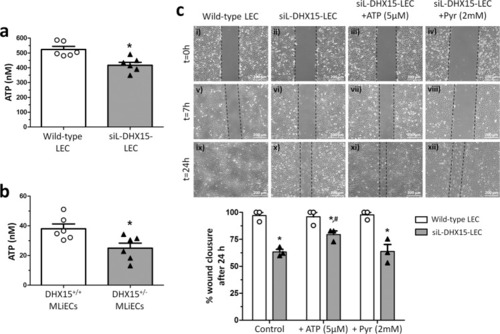
siL-DHX15-LEC presented less cell migration.a ATP production was evaluated by a luminescence assay in wild-type and siL-DHX15-LEC. Bars represent the mean ± SEM, *p < 0.05 vs. wild-type LEC (n = 6 biologically independent samples for each condition). b ATP production was evaluated by a luminescence assay in MLiEC isolated from wild-type and DHX15+/− mice. Bars represent the mean ± SEM, *p < 0.05 vs. wild-type LEC (n = 3 biologically independent samples for each condition). c Cell migration was quantified after performing a scratch wound in confluent non-silenced and silenced LECs cells that were cultured in six-well plates. Then images of wound healing were acquired after 0, 7, and 24 h (n = 6 independent experiments). Graph shows the quantification of the wound closure after 24 h as percentage of migration. Bars represent the mean ± SEM, *p < 0.05 vs. respective wild-types and #p < 0.05 vs. siL-DHX15-LECs without ATP and the pyruvate condition (Pyr). For a and b statistical analyses were performed using unpaired two-tailed Student’s t-test; for c statistical analysis was performed using one-way ANOVA with Tukey’s post hoc test for multiple comparisons. All bar graphs are presented as mean ± SEM.
|