FIGURE SUMMARY
Title

Heterodimer-heterotetramer formation mediates enhanced sensor activity in a biophysical model for BMP signaling

Authors
Karim, M.S., Madamanchi, A., Dutko, J.A., Mullins, M.C., Umulis, D.M.
Source
Full text @ PLoS Comput. Biol.

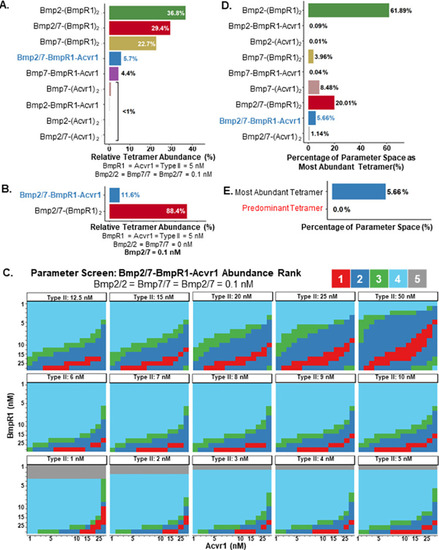
Oligomerization kinetics do not explain heterodimer-heterotetramer dominance.

A. Proportion of ligand-receptor tetrameric complexes at equimolar receptor at physiological conditions. The heterodimer-heterotetramer is only the fourth most abundant tetrameric complex. B. Proportion of ligand-receptor tetrameric complexes in a simulation with no homodimer ligand. Heterodimer-heterotetramer production is still not kinetically favored. C. Visualization of the prevalence of heterodimer-heterotetramer compared to other ligand-receptor tetramers in 3,375 points of a 84,375 point screen. The red region represents parameter space in which the heterodimer-heterotetramer is the most prevalent species (3.84% of this sample. D. The portion of the parameter space in which each ligand-receptor tetrameric complex is the most abundant. E. The portion of the parameter space in which the heterodimer-heterotetramer is the most abundant ligand-receptor tetrameric complex (5.66%) and the predominant tetrameric complex (0.0%).

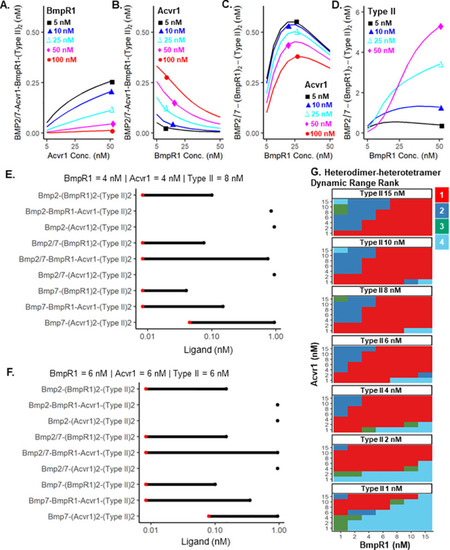
Heterodimer-heterotetramer prevalence under different conditions.

A. Shows the distributions of the complexes as a function of ligand concentration in a system with excess Acvr1. The level of BmpR1 receptor complexes exceeds the level of Bmp2/7-Acvr1-BmpR1-(Type II)2 except for a narrow band from ~.4nM to 1 nM. B. The weakest possible Acvr1 –Bmp2/7 binding affinity in which Bmp2/7-Acvr1-BmpR1-(Type II)2 is the most prevalent receptor tetramer at a ligand concentration of 0.1 nM. Recall that higher KD (nM) indicates weaker binding affinity. C-D. Same as A and B with higher amounts of Type II receptor in the model. E. In the Bmp2/7-only system with 10nM type II receptor, 9-fold excess Acvr1 leads to greater heterodimer-heterotetramer complex formation over a wide range of ligand concentration.

Heterodimer sensitivity and dynamic range.

A-D. Bmp2 = Bmp7 = Bmp2/7 = 0.3 nM; (A-C) Type II = 10 nM; (D) Acvr1 = 10 nM. (A) Bmp2/7-heteromeric receptor complex formation (y-axis) exhibits low sensitivity to Acvr1 levels (x-axis), but B. high sensitivity to increasing BmpR1 levels (x-axis). C-D. Levels of BMP2/7-BmpR1-BmpR1 signaling complexes (y-axis) versus increasing levels of BmpR1 for different levels of Acvr1 C. or Type II D. receptors. E-F. Dynamic range, i.e. ligand concentrations needed to produce a single (red point) ligand-receptor complex and maximal ligand receptor complex (black point) for each of the nine plausible tetrameric ligand-receptor oligomers. Oligomers represented by a single point are unable to produce a single tetrameric ligand receptor complex at these ligand and receptor concentrations. The red point signifies, for each tetramer, the higher of a single molecule of ligand, or G. Shows a 343 point parameter screen measuring dynamic range under different receptor concentrations. The heterodimer-heterotetramer has the largest dynamic range in 63.56% of the tested conditions.

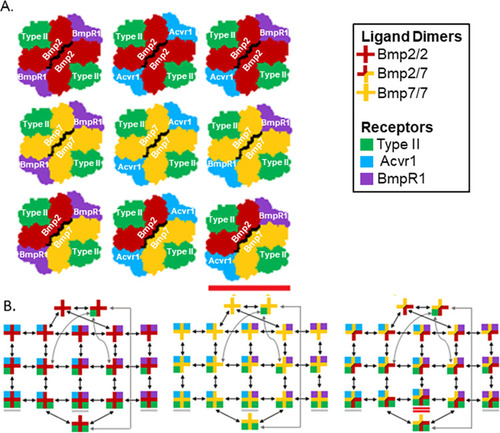
BMP ligand receptor interactions and oligomerization network.

A. Cartoon depiction of ‘overhead view’ of BMP ligand-dimer receptor-tetramer complexes. BMP signaling occurs through an oligomeric signaling complex which necessarily consists of a ligand dimer (red/gold plus) bound to a receptor tetramer. The receptor tetramer requires two Type II receptors (green square) and two Type I receptors (BmpR1 in purple and/or Acvr1 in cyan). The heterodimer-heterotetramer is underlined in red. B. Network of BMP ligand-receptor interactions. Oligomeric signaling complexes are formed through reversible reactions (double-sided arrows). Tetrameric complexes are underlined in the figure above. The heterodimer-heterotetramer, Bmp2/7-Acvr1-BmpR1-(Type II)2 is double underlined.

Acknowledgments
This image is the copyrighted work of the attributed author or publisher, and ZFIN has permission only to display this image to its users. Additional permissions should be obtained from the applicable author or publisher of the image. Full text @ PLoS Comput. Biol.