|
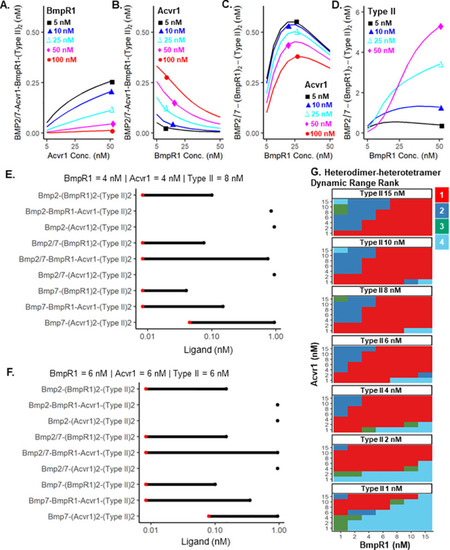
Heterodimer sensitivity and dynamic range.A-D. Bmp2 = Bmp7 = Bmp2/7 = 0.3 nM; (A-C) Type II = 10 nM; (D) Acvr1 = 10 nM. (A) Bmp2/7-heteromeric receptor complex formation (y-axis) exhibits low sensitivity to Acvr1 levels (x-axis), but B. high sensitivity to increasing BmpR1 levels (x-axis). C-D. Levels of BMP2/7-BmpR1-BmpR1 signaling complexes (y-axis) versus increasing levels of BmpR1 for different levels of Acvr1 C. or Type II D. receptors. E-F. Dynamic range, i.e. ligand concentrations needed to produce a single (red point) ligand-receptor complex and maximal ligand receptor complex (black point) for each of the nine plausible tetrameric ligand-receptor oligomers. Oligomers represented by a single point are unable to produce a single tetrameric ligand receptor complex at these ligand and receptor concentrations. The red point signifies, for each tetramer, the higher of a single molecule of ligand, or G. Shows a 343 point parameter screen measuring dynamic range under different receptor concentrations. The heterodimer-heterotetramer has the largest dynamic range in 63.56% of the tested conditions.
|