
- Title
-
The protein kinase LKB1 promotes self-renewal and blocks invasiveness in glioblastoma
- Authors
- Caja, L., Dadras, M.S., Mezheyeuski, A., Rodrigues-Junior, D.M., Liu, S., Webb, A.T., Gomez-Puerto, M.C., Ten Dijke, P., Heldin, C.H., Moustakas, A.
- Source
- Full text @ J. Cell. Physiol.
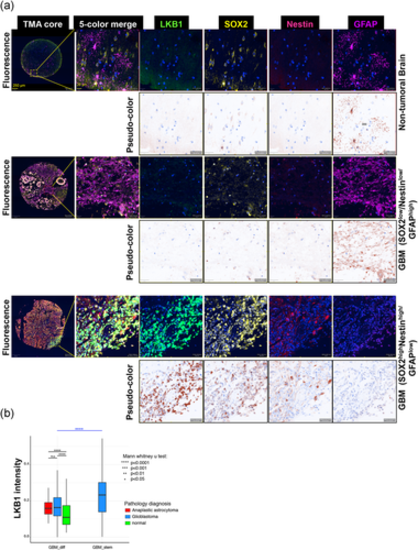
LKB1 protein analysis in GBM. (a) LKB1, SOX2, NESTIN, and GFAP immunolocalization in the non-tumoral brain and GBM tissue (representative images; Figure S2 shows more images). Original fluorescent images for the four different protein markers plus DAPI (blue), the 5-color merge, and the complete stained core are shown. The individual protein stainings are converted to brown pseudo-color. Magnification bars: 250 and 20 µm. (b) Glioblastoma, anaplastic astrocytoma, and non-tumoral brain tissue cells were classified into two groups, based on the expression of two different stem cell markers, NESTIN, and SOX2, and an astrocytic differentiation marker, GFAP: SOX2high/NESTINhigh/GFAPlow (GBM_stem) and SOX2low/NESTINlow/GFAPhigh (GBM_diff). Note that the GBM_stem group can only be identified in GBM (blue plot) but not in non-tumoral (normal, green plot) or anaplastic astrocytoma (red plot) tissues; significant differences at ****p < 0.0001. DAPI, 4′,6-diamidino-2-phenylindole; GBM, glioblastoma; LKB1, liver kinase B1; n.s., not significant |
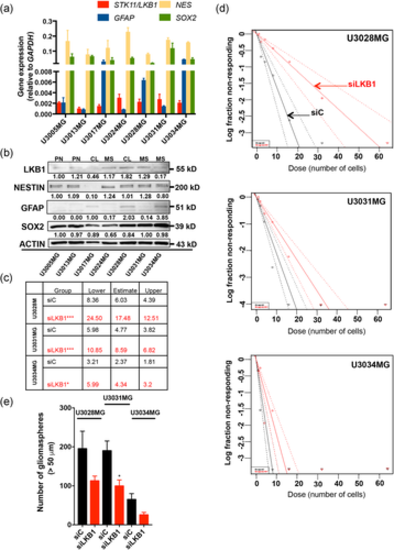
LKB1 is required for optimal gliomasphere formation. (a, b) RT-PCR (a) and immunoblot (b) analysis of LKB1/STK11, GFAP, NESTIN (NES), and SOX2 levels in GBM cultures; GAPDH served as a normalization control for mRNA and β-ACTIN (ACTIN) for protein analysis. Densitometric quantification of LKB1, NESTIN, GFAP, and SOX2 protein expression relative to β-ACTIN, with the basal expression level of each protein in U3005MG arbitrarily set to 1.00. Note the exception for GFAP, where the basal levels of U3017MG are expressed as 1.00. (c) Extreme limiting dilution assay table indicating average stem cell frequency per cell group (three to four independent experiments; seven technical repeats), and lower/upper confidence interval limits. (d) Extreme limiting dilution assay of three GBM cultures transfected with siC (black symbols) or siLKB1 (red symbols; siRNA pool) and cultured for 7 days. The number of sphere-containing wells per plating density is plotted. Steeper slopes indicate higher frequencies of sphere-forming cells. (e) Number of gliomaspheres (>50 µm) are shown as mean ± SEM of two independent experiments performed in duplicate, after transfection with siC (black bars) or siLKB1 (red bars; siRNA pool). Significant differences at *p < 0.05, ***p < 0.001 by one-way analysis of variance. GAPDH, glyceraldehyde 3-phosphate dehydrogenase; GBM, glioblastoma; LKB1, liver kinase B1; mRNA, messenger RNA; RT-PCR, reverse-transcription polymerase chain reaction; siRNA, small interfering RN |
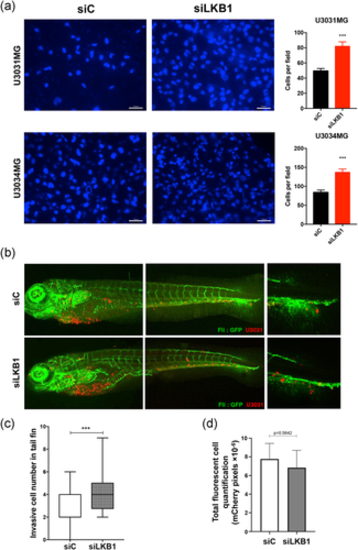
Silencing of LKB1 enhances GBM cell invasion. (a) U3031MG and U3034MG cells transfected with unspecific (siC) or LKB1-targeting (siLKB1 pool) siRNA were analyzed in invasion assays. Representative invading cell images (left, scale bar = 20 µm) and quantification of invading cells (right, n = 3 in duplicate; 20 fields quantified per independent experiment). (b) In vivo invasive capacity of U3031MG after silencing LKB1 (siLKB1 pool), assessed in zebrafish embryos. Representative images of circulating, invading GBM cells (red-marked cells) and vasculature (green due to endothelial-specific EGFP expression) in transgenic zebrafish are shown. Extravasation and collagenous tail fin invasion are observed (right-hand photomicrograph). Invading cells per fish, n = 40 were quantified, and presented as mean ± SEM. Statistical comparison (t-test); significant differences at ***p < 0.001. GBM, glioblastoma; LKB1, liver kinase B1; SEM, standard error of the mean; siRNA, small interfering RNA |
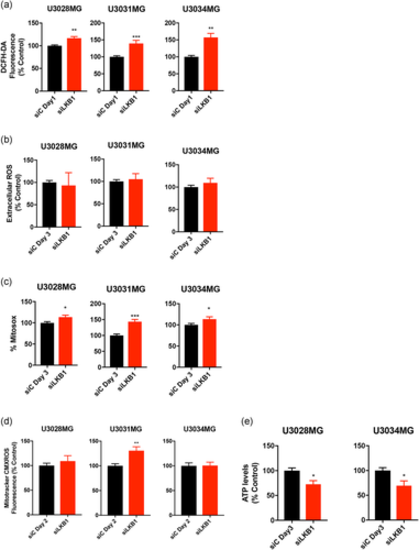
Silencing of LKB1 results in increased ROS production and reduced ATP levels. GBM cultures were transfected with siC (black bars) or siLKB1 siRNA (red bars; siRNA pool) for the indicated number of days. (a) Intracellular peroxide content was measured fluorimetrically using DCFH-DA; results are mean ± SEM of two to three independent experiments performed in triplicate. (b) Extracellular peroxide content was measured fluorimetrically using Amplex UltraRed; results are mean ± SEM of four independent experiments performed in quadruplicate. (c) Mitochondrial superoxide measured by MitoSOX Red; results are mean ± SEM of four to five independent experiments performed in triplicate. (d) Mitochondrial transmembrane potential by Mitotracker CMXROS; results are mean ± SEM of two to five independent experiments. (e) ATP levels; results are mean ± SEM of two independent experiments. A t-test indicates significant differences at: *p< 0.05, **p < 0.01, ***p < 0.001. DCFH-DA, 2,7-dichlorofluorescein diacetate; GBM, glioblastoma; LKB1, liver kinase B1; ROS, reactive oxygen species; SEM, standard error of the mean; siRNA, small interfering RNA |
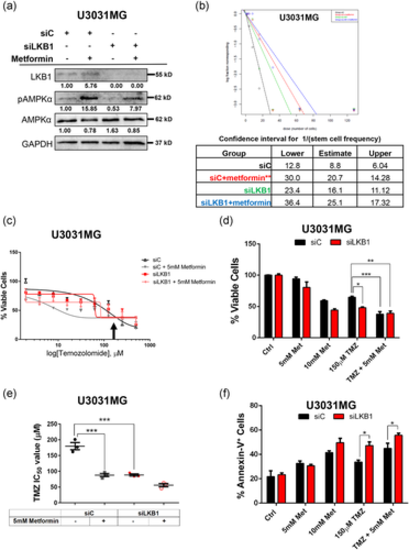
Metformin- and temozolomide-mediated GBM cytotoxicity. (a) Efficiency of AMPKα activation by metformin. U3031MG cells were transfected with the indicated siRNAs for 48 h and treated with DMSO (-) or 5 mM metformin for another 24 h, before cell lysis and immunoblotting for the indicated proteins. Densitometric quantification of LKB1, phosphorylated (activation loop) AMPKα (pAMPKα) and total AMPKα protein levels relative to GAPDH, with the basal expression levels of LKB1, pAMPKα, and AMPKα in U3031MG siC (lane 1) arbitrarily set to 1.00. (b) Extreme limiting dilution assay of U3031MG cells transfected with siC (black, red symbols) or siLKB1 (green, blue symbols; siRNA pool), treated with DMSO (black, green symbols) or 5 mM metformin (red, blue symbols), and cultured for 7 days. The number of sphere-containing wells per plating density is plotted in the table below. (c) Cell viability assay of U3031MG cells transfected with siC or siLKB1, treated with DMSO, 5 mM metformin or increasing concentrations of TMZ, and cultured for 24 h. The % of viable cells is plotted relative to the siC treated only with DMSO. An arrow shows 125 µM TMZ used in panel (d). (d) Cell viability assay of U3031MG cells transfected with siC or siLKB1 (pool), treated with DMSO, 5 or 10 mM metformin with or without 125 µM TMZ, and cultured for 24 h. The percentage of viable cells is plotted relative to the siC treated only with DMSO. (e) The lowest dose of TMZ (µM) required for 50% inhibition of viability (IC50) of U3031MG cells transfected with siC or siLKB1, co-treated with DMSO or 5 mM metformin and cultured for 24 h. (f) Cell death assay measuring the percent of annexin-V-positive cells using flow cytometry of U3031MG cells transfected with siC or siLKB1 (pool) and co-treated with DMSO, 5 or 10 mM metformin with or without 125 µM TMZ and cultured for 24 h. The results (b–f) are mean ± SEM of at least two independent experiments and significant differences at *p < 0.05, **p < 0.01 by one-way analysis of variance. GBM, glioblastoma; DMSO, dimethyl sulfoxide; GAPDH, glyceraldehyde 3-phosphate dehydrogenase; LKB1, liver kinase B1; siRNA, small interfering RNA; TMZ, temozolomide |
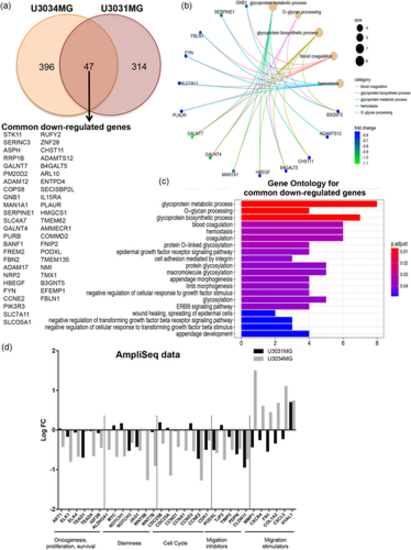
Transcriptomic analysis of GBM cells after LKB1 knock-down. (a) Venn diagram and list showing common downregulated genes between U3031MG and U3034MG cells with a LogFC < −0.5 and FDR < 0.05. (b) Graphical representation of downregulated genes from the top GO BP terms (number of genes per category is shown by circle diameter; fold-change in expression by color). (c) Gene Ontology enrichment for BP of the 47 common downregulated genes after LKB1 silencing. Adjusted p-value is color-coded. (d) Graphical representation of the log-FC of the indicated genes (siLKB1 pool vs. siC from the Ampliseq analysis) derived from triplicate samples of the two GBM cultures. BP, biological process; FC, fold change; FDR, false discovery rate; GBM, glioblastoma; LKB1, liver kinase B1 |
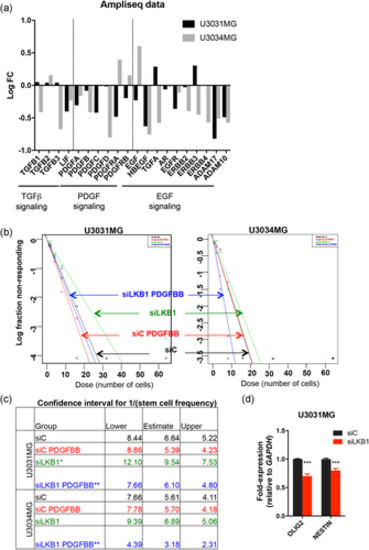
LKB1 maintains gliomasphere potential by regulating growth factor expression. (a) Graphical representation of the log-FC of the indicated genes (siLKB1 vs. siC Ampliseq analysis) derived from triplicate samples of the two GBM cultures. (b) Extreme limiting dilution assay of cells cultured in the indicated conditions (PDGF-BB 25 ng/ml). (c) The table indicates average stem cell frequency per cell group (three to four independent experiments; seven technical repeats), and lower/upper confidence interval limits. (d) Expression of the indicated genes after LKB1 silencing (pool); results are mean ± SEM of two independent experiments; significant differences as *p < 0.05, **p < 0.01, ***p < 0.001 by one-way analysis of variance. FC, fold change; GBM, glioblastoma; LKB1, liver kinase B1; PDGF, platelet-derived growth factor; SEM, standard error of the mean |