
|
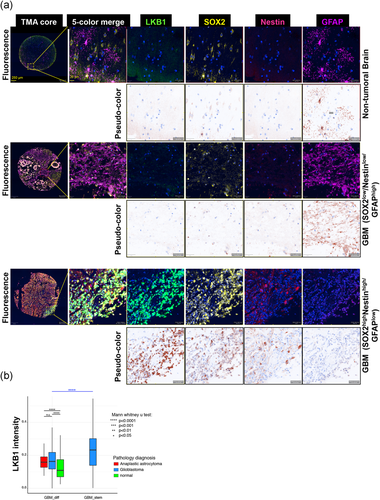
Fig. 1 LKB1 protein analysis in GBM. (a) LKB1, SOX2, NESTIN, and GFAP immunolocalization in the non-tumoral brain and GBM tissue (representative images; Figure S2 shows more images). Original fluorescent images for the four different protein markers plus DAPI (blue), the 5-color merge, and the complete stained core are shown. The individual protein stainings are converted to brown pseudo-color. Magnification bars: 250 and 20 µm. (b) Glioblastoma, anaplastic astrocytoma, and non-tumoral brain tissue cells were classified into two groups, based on the expression of two different stem cell markers, NESTIN, and SOX2, and an astrocytic differentiation marker, GFAP: SOX2high/NESTINhigh/GFAPlow (GBM_stem) and SOX2low/NESTINlow/GFAPhigh (GBM_diff). Note that the GBM_stem group can only be identified in GBM (blue plot) but not in non-tumoral (normal, green plot) or anaplastic astrocytoma (red plot) tissues; significant differences at ****p < 0.0001. DAPI, 4′,6-diamidino-2-phenylindole; GBM, glioblastoma; LKB1, liver kinase B1; n.s., not significant