
|
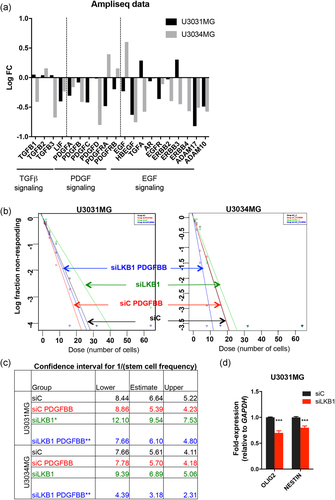
Fig. 7 LKB1 maintains gliomasphere potential by regulating growth factor expression. (a) Graphical representation of the log-FC of the indicated genes (siLKB1 vs. siC Ampliseq analysis) derived from triplicate samples of the two GBM cultures. (b) Extreme limiting dilution assay of cells cultured in the indicated conditions (PDGF-BB 25 ng/ml). (c) The table indicates average stem cell frequency per cell group (three to four independent experiments; seven technical repeats), and lower/upper confidence interval limits. (d) Expression of the indicated genes after LKB1 silencing (pool); results are mean ± SEM of two independent experiments; significant differences as *p < 0.05, **p < 0.01, ***p < 0.001 by one-way analysis of variance. FC, fold change; GBM, glioblastoma; LKB1, liver kinase B1; PDGF, platelet-derived growth factor; SEM, standard error of the mean