
|
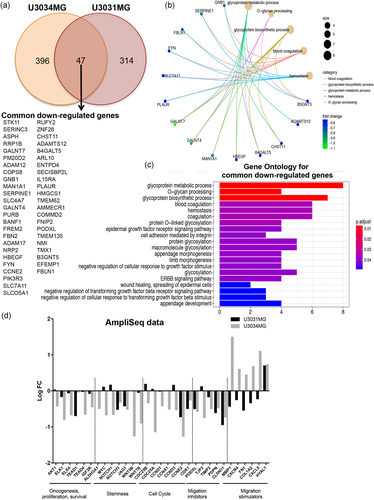
Fig. 6 Transcriptomic analysis of GBM cells after LKB1 knock-down. (a) Venn diagram and list showing common downregulated genes between U3031MG and U3034MG cells with a LogFC < −0.5 and FDR < 0.05. (b) Graphical representation of downregulated genes from the top GO BP terms (number of genes per category is shown by circle diameter; fold-change in expression by color). (c) Gene Ontology enrichment for BP of the 47 common downregulated genes after LKB1 silencing. Adjusted p-value is color-coded. (d) Graphical representation of the log-FC of the indicated genes (siLKB1 pool vs. siC from the Ampliseq analysis) derived from triplicate samples of the two GBM cultures. BP, biological process; FC, fold change; FDR, false discovery rate; GBM, glioblastoma; LKB1, liver kinase B1