
|
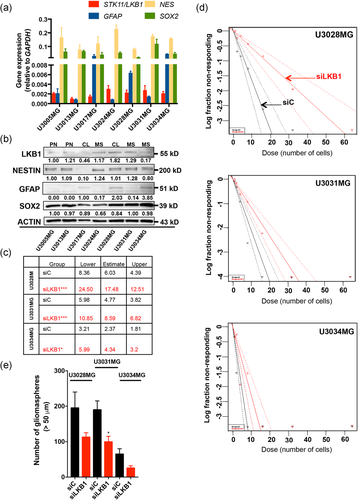
Fig. 2 LKB1 is required for optimal gliomasphere formation. (a, b) RT-PCR (a) and immunoblot (b) analysis of LKB1/STK11, GFAP, NESTIN (NES), and SOX2 levels in GBM cultures; GAPDH served as a normalization control for mRNA and β-ACTIN (ACTIN) for protein analysis. Densitometric quantification of LKB1, NESTIN, GFAP, and SOX2 protein expression relative to β-ACTIN, with the basal expression level of each protein in U3005MG arbitrarily set to 1.00. Note the exception for GFAP, where the basal levels of U3017MG are expressed as 1.00. (c) Extreme limiting dilution assay table indicating average stem cell frequency per cell group (three to four independent experiments; seven technical repeats), and lower/upper confidence interval limits. (d) Extreme limiting dilution assay of three GBM cultures transfected with siC (black symbols) or siLKB1 (red symbols; siRNA pool) and cultured for 7 days. The number of sphere-containing wells per plating density is plotted. Steeper slopes indicate higher frequencies of sphere-forming cells. (e) Number of gliomaspheres (>50 µm) are shown as mean ± SEM of two independent experiments performed in duplicate, after transfection with siC (black bars) or siLKB1 (red bars; siRNA pool). Significant differences at *p < 0.05, ***p < 0.001 by one-way analysis of variance. GAPDH, glyceraldehyde 3-phosphate dehydrogenase; GBM, glioblastoma; LKB1, liver kinase B1; mRNA, messenger RNA; RT-PCR, reverse-transcription polymerase chain reaction; siRNA, small interfering RN