
|
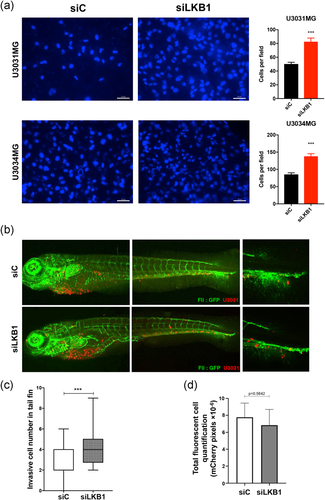
Fig. 3 Silencing of LKB1 enhances GBM cell invasion. (a) U3031MG and U3034MG cells transfected with unspecific (siC) or LKB1-targeting (siLKB1 pool) siRNA were analyzed in invasion assays. Representative invading cell images (left, scale bar = 20 µm) and quantification of invading cells (right, n = 3 in duplicate; 20 fields quantified per independent experiment). (b) In vivo invasive capacity of U3031MG after silencing LKB1 (siLKB1 pool), assessed in zebrafish embryos. Representative images of circulating, invading GBM cells (red-marked cells) and vasculature (green due to endothelial-specific EGFP expression) in transgenic zebrafish are shown. Extravasation and collagenous tail fin invasion are observed (right-hand photomicrograph). Invading cells per fish, n = 40 were quantified, and presented as mean ± SEM. Statistical comparison (t-test); significant differences at ***p < 0.001. GBM, glioblastoma; LKB1, liver kinase B1; SEM, standard error of the mean; siRNA, small interfering RNA