
|
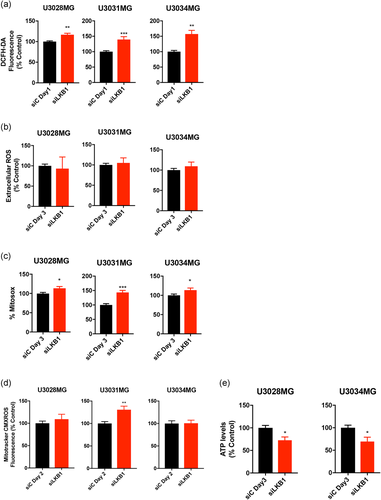
Fig. 4 Silencing of LKB1 results in increased ROS production and reduced ATP levels. GBM cultures were transfected with siC (black bars) or siLKB1 siRNA (red bars; siRNA pool) for the indicated number of days. (a) Intracellular peroxide content was measured fluorimetrically using DCFH-DA; results are mean ± SEM of two to three independent experiments performed in triplicate. (b) Extracellular peroxide content was measured fluorimetrically using Amplex UltraRed; results are mean ± SEM of four independent experiments performed in quadruplicate. (c) Mitochondrial superoxide measured by MitoSOX Red; results are mean ± SEM of four to five independent experiments performed in triplicate. (d) Mitochondrial transmembrane potential by Mitotracker CMXROS; results are mean ± SEM of two to five independent experiments. (e) ATP levels; results are mean ± SEM of two independent experiments. A t-test indicates significant differences at: *p< 0.05, **p < 0.01, ***p < 0.001. DCFH-DA, 2,7-dichlorofluorescein diacetate; GBM, glioblastoma; LKB1, liver kinase B1; ROS, reactive oxygen species; SEM, standard error of the mean; siRNA, small interfering RNA