
- Title
-
Cdan1 Is Essential for Primitive Erythropoiesis
- Authors
- Noy-Lotan, S., Dgany, O., Marcoux, N., Atkins, A., Kupfer, G.M., Bosques, L., Gottschalk, C., Steinberg-Shemer, O., Motro, B., Tamary, H.
- Source
- Full text @ Front. Physiol.
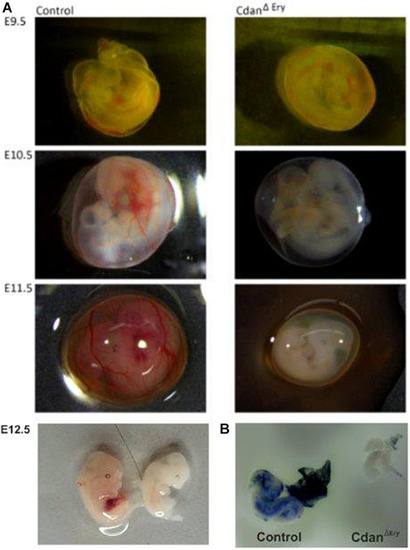
CdanΔ |
Erythroid-specific knockout of |

CdanΔ |
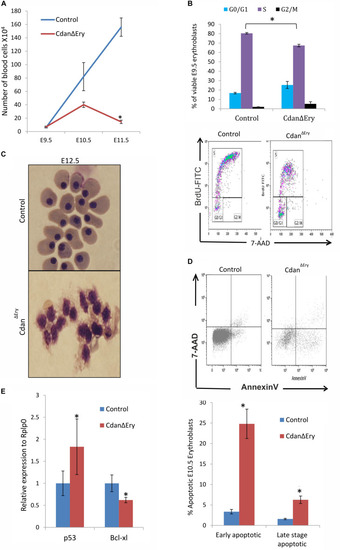
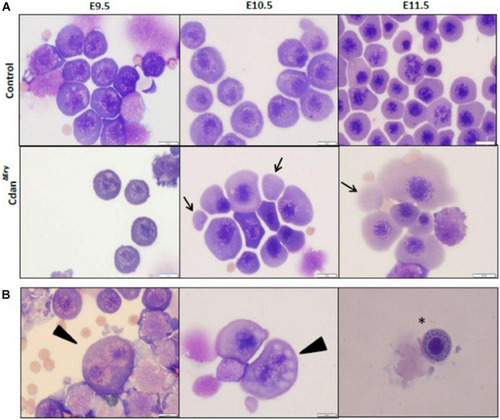
Cdan1 depletion impairs cell cycle progression and increases cell death. (A) Number of circulating primitive erythroid cells collected from E9.5 to E11.5 control and CdanΔEry embryos. Values represent mean ± Standard error. CdanΔEry: n = 3; Control: n = 9. *p < 0.002 compared to controls. (B) CdanΔEry E9.5 erythroblasts show aberrant G1-to-S progression. The percentage of cells in G0/G1, S and G2/M phases of the cell cycle in wild-type (control) and CdanΔEry E9.5 erythroblasts gated for the CD71+/Ter119+ population. CdanΔEry n = 3; control n = 12. Error bars indicate standard error. *p < 0.02 compared to wild-type. (C) Morphology of E12.5 CdanΔEry circulating erythroblasts, compared to littermate controls. (D) E10.5 peripheral blood cells were gated for CD71+/Ter119+ erythroblasts, and analyzed for AnnexinV/7AAD staining to assess for apoptosis (Representative flow plots are shown in upper panel). Early apoptotic cells are AnnexinV-positive/7-AAD-negative; Late apoptotic cells are double positive. Data presented as mean ± SEM (n = 3-4 for each genotype). *p < 0.005. (E) Cdan1 ablation decreases Bcl-xl expression and increases p53 levels. qRT-PCR was performed with RNA extracted from peripheral blood cells at E11.5 and normalized to Rplp0. Relative expression data are presented as mean ± SEM (n = 4–6 for each genotype). Student’s t-test was applied for statistical analysis. Asterisks indicate significant difference from the Control. *p < 0.05. |
|
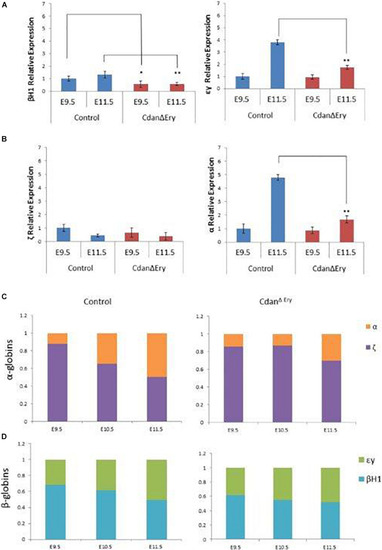
Dysregulated embryonal globin expression in CdanΔ |
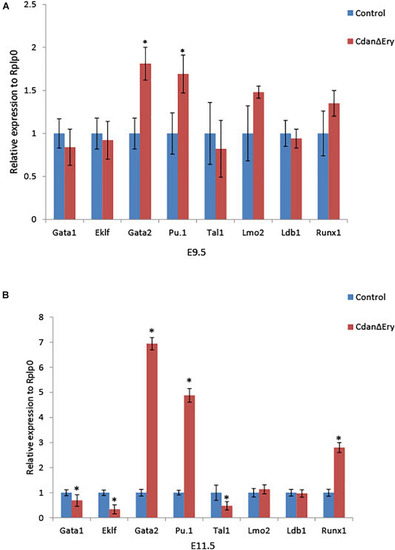
|
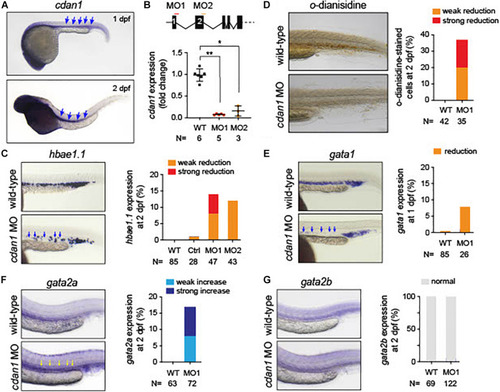
Loss of |