
- Title
-
Targeting senescent cells improves functional recovery after spinal cord injury
- Authors
- Paramos-de-Carvalho, D., Martins, I., Cristóvão, A.M., Dias, A.F., Neves-Silva, D., Pereira, T., Chapela, D., Farinho, A., Jacinto, A., Saúde, L.
- Source
- Full text @ Cell Rep.
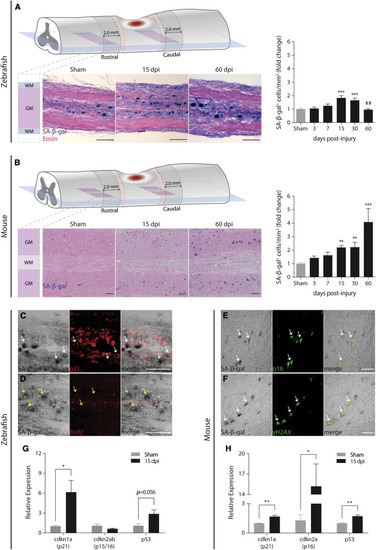
Different senescent cell dynamics are induced after spinal cord injury in zebrafish and in mice (A and B) SA-β-gal+ cells (blue) were detected and quantified in non-injured (sham) and injured zebrafish spinal cords at different time points (3, 7, 15, 30, and 60 days post-injury [dpi]). n = 5–16. Similarly, SA-β-gal+ cells were detected and quantified in mouse laminectomized (sham) and injured spinal cords at the same time points. n = 4–16. Eosin counterstaining was performed after cryosectioning. Cells were quantified at the lesion periphery along 2.0 mm in longitudinal sections spanning the ventral horn. A 0.5-mm interval (red dashed zone) was established between the lesion border and the beginning of the quantification region. SA-β-gal+ cells were only quantified in the gray matter (GM) and not in the white matter (WM). Quantifications are presented as fold change toward sham. In zebrafish, SA-β-gal+ cells reach a peak at 15 dpi (238.6 cells/mm2), a 2-fold increase compared to sham (127.2 cells/mm2). In mice, SA-β-gal+ cells display a 4-fold increase at 60 dpi (80.0 cells/mm2) toward sham (19.0 cells/mm2). Data are presented as mean ± SEM. ∗p < 0.05, ∗∗p < 0.01, ∗∗∗p < 0.001, versus sham; ##p < 0.01, 60 versus 30 dpi. Scale bars, 100 μm. (C and D) In zebrafish, SA-β-gal+ cells co-localized with the senescence biomarker p21 and were devoid of the proliferation marker BrdU. Images were taken at 15 dpi. White arrows point to representative examples of co-localization, while yellow arrows point to the absence of co-localization. Scale bars, 100 μm. (E and F) In mice, a similar co-localization was found between SA-β-gal+ cells and the senescence biomarkers p16 and γH2AX. White arrows point to representative examples of co-localization. Scale bars, 100 μm. (G and H) At 15 dpi, the expression of senescence biomarkers, namely cdkn1a (encodes for p21), cdkn2ab (encodes for p15/16 in zebrafish), cdkn2a (encodes for p16 in mice), and p53, was evaluated by qPCR. Results are presented as relative expression toward sham. Data are presented as mean ± SEM. ∗p < 0.05, ∗∗p < 0.01, versus sham. |
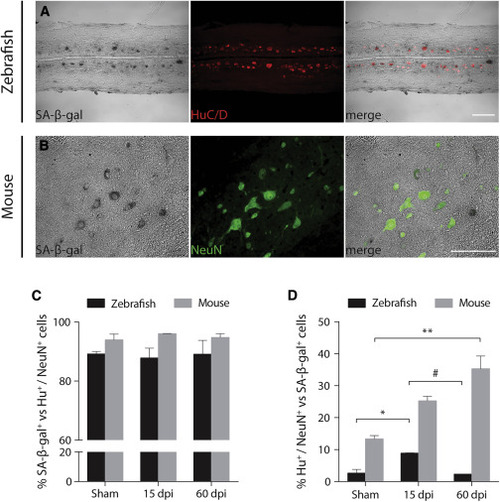
Different profiles of SA-β-gal+ neuronal populations between zebrafish and mouse (A and B) In zebrafish and mice, SA-β-gal+ cells (black) co-localized with the neuronal markers (A) HuC/D (red) and (B) NeuN (green), respectively. Representative images were taken at 15 days post-injury (dpi). Scale bars, 100 μm. (C and D) Percentages of total SA-β-gal+ cells that are HuC/D+ or NeuN+ and of total HuC/D+ or NeuN+ neurons that are SA-β-gal+ are compared between both models. Cells were quantified at the lesion periphery along 2.0 mm in longitudinal sections. A 0.5-mm interval was established between the lesion border and the beginning of the quantification region. Quantifications are presented for uninjured/laminectomized (sham) zebrafish/mice at 15 and 60 dpi. n = 2–4. Data are presented as mean ± SEM. ∗p < 0.05, ∗∗p < 0.01, versus sham; #p < 0.05, versus 15 dpi. |
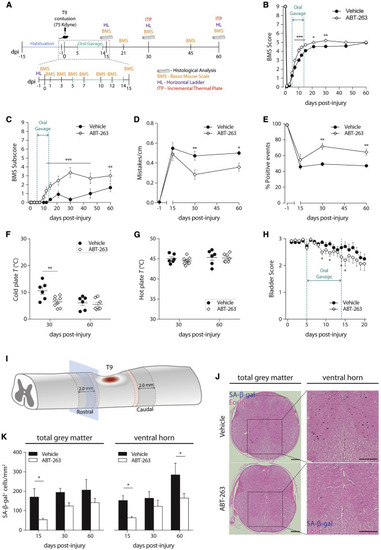
Targeting senescent cells with ABT-263 improves motor, sensory, and bladder function recovery following a spinal cord injury in mice (A) Schematic of the experimental setup. Animals were habituated to the different behavioral setups for a 15-day period, before being submitted to a moderate-to-severe (force, 75 Kdyne; displacement, 550–750 μm) T9 contusion injury. Injured animals received daily vehicle or ABT-263 via oral gavage, from 5 to 14 dpi. (B and C) Basso Mouse Scale (BMS) score and subscore were evaluated in an open field at different time-points (0, 1, 3, 5, 7, 10, 12, 15, 21, 30, 45, and 60 dpi). n = 18–19. (D and E) The locomotor performance in the horizontal ladder (HL) was assessed at −1 (control), 15, 30, and 60 dpi by quantifying the total number of mistakes per centimeter and the percentage of singular positive events (plantar step, toe step, and skip) measured and averaged across three successful trials. n = 3-6. (F and G) Thermal allodynia was tested at 30 and 60 dpi by determining the temperature at which injured mice reacted to a cold or hot stimulus. n = 6–8. (H) Bladder function was grossly evaluated by attributing a bladder score to the amount of urine collected each time a bladder was manually voided. n = 18–19. (I) SA-β-gal+ cells were quantified in a total of 10 different transversal sections (5 rostral and 5 caudal) along 2.0 mm at the lesion periphery. A 0.5-mm interval (red dashed zone) was established between the lesion and the beginning of the quantification region. (J) Eosin counterstaining was performed after cryosectioning. SA-β-gal+ cells (blue) were quantified in the total sectional gray matter and only at the ventral horn. Scale bars, 200 μm. (K) Quantifications were performed at all experimental endpoints (15, 30, and 60 dpi). At 15 dpi, ABT-263 treatment significantly decreased the number of SA-β-gal+ cells/mm2 in the total gray matter and in the ventral horn by 68.4% and 58.0%, respectively. At 60 dpi, a significant reduction (41.9%) of SA-β-gal+ cells/mm2 in ABT-263-treated animals was still observed in the ventral horn. n (15 dpi) = 3–4; n (30 dpi) = 3–4; n (60 dpi) = 2–3. Data are presented as mean ± SEM. ∗p < 0.05, ∗∗p < 0.01, ∗∗∗p < 0.001, ABT-263 versus vehicle. |
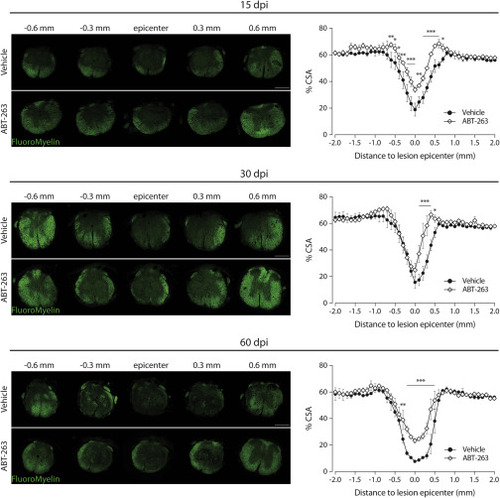
White matter sparing is increased after targeting senescent cells with ABT-263 Transversal sections at different distances from the lesion epicenter of an injured spinal cord at 15, 30 and 60 dpi, treated with vehicle or ABT-263, and stained with FluoroMyelin (green) and the corresponding quantifications. White matter sparing was assessed by normalizing the area stained with FluoroMyelin (green) to the total cross-sectional area (CSA) of spinal cord sections every 100 μm ranging from 2 mm rostral and 2 mm caudal to the lesion epicenter. Scale bars, 500 μm. n (15 dpi) = 3–4; n (30 dpi) = 3–4; n (60 dpi) = 2–3. Data are expressed as % CSA and presented as mean ± SEM. ∗p < 0.05, ∗∗p < 0.01, ∗∗∗p < 0.001, ABT-263 versus vehicle. |
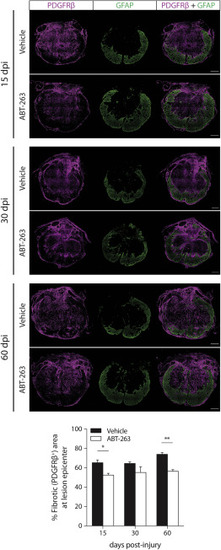
Targeting senescent cells leads to a reduction of the fibrotic scar Transversal sections at the lesion epicenter of an injured spinal cord at 15, 30, and 60 dpi treated with vehicle or ABT-263 and stained with the fibrotic scar marker PDGFRβ+ (magenta) and with the astrocytic scar marker GFAP (green). The fibrotic scar area was evaluated by normalizing the PDGFRβ+ area to the total cross-sectional area at the lesion epicenter. GFAP+ tissue surrounds the fibrotic core. Scale bars, 200 μm. n (15 dpi) = 3–4; n (30 dpi) = 3–4; n (60 dpi) = 2–3. The lower panel shows the percentage of fibrotic tissue in the injury core as quantified at 15, 30 and 60 dpi. Data are presented as mean ± SEM. ∗p < 0.05, ∗∗p < 0.01, ABT-263 versus vehicle. |
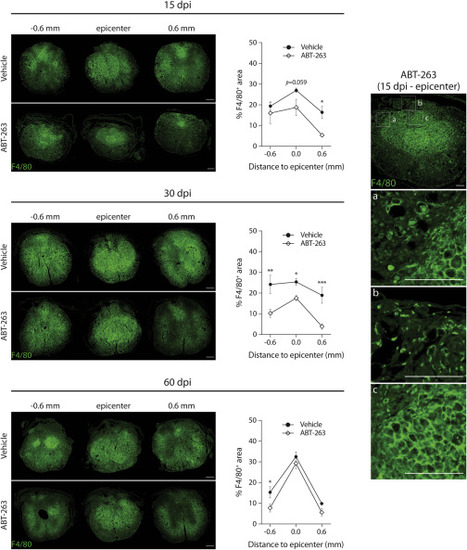
ABT-263 treatment decreases the number of macrophages at the injury site Transversal sections at the lesion epicenter of an injured spinal cord at 15, 30 and 60 dpi treated with vehicle or ABT-263 and stained with the pan-macrophage marker F4/80 (green). Scale bars, 200 μm. The area of F4/80+ tissue was measured at the lesion epicenter and 600 μm rostrally and caudally from the epicenter. The panel on the right displays zoomed images of three different zones (a–c) of an ABT-263-treated spinal cord transversal section stained with F4/80 at 15 dpi. Macrophages form a network inside the central lesion core, but they can be individually distinguished outside of it. Scale bars, 100 μm. Measurements are expressed as a percentage of the total cross-sectional area. n (15 dpi) = 3–4; n (30 dpi) = 3–4; n (60 dpi) = 2–3. Data are presented as mean ± SEM. ∗p < 0.05, ∗∗p < 0.01, ∗∗∗p < 0.001, ABT-263 versus vehicle. |
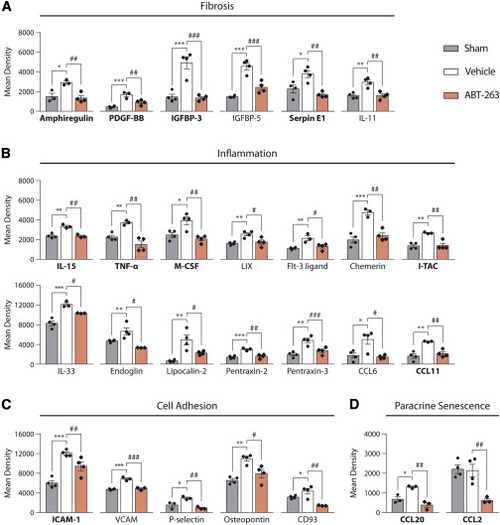
Targeting SCs with ABT-263 reduces key pro-inflammatory and pro-fibrotic factors that are induced upon spinal cord injury (A–D) Cytokine and chemokine expression was measured in spinal cord homogenates from laminectomized (sham), vehicle-, and ABT-263-treated animals at 15 dpi. From a total of 111 factors analyzed, 26 were both upregulated upon injury (sham versus vehicle) and significantly decreased after ABT-263 treatment (vehicle versus ABT-263). Factors were divided in different groups regarding their role in (A) fibrosis, (B) inflammation, (C) cell adhesion, or (D) paracrine senescence. Some of the identified factors, displayed in bold, have been previously described as SASP factors. Data are expressed as mean density and presented as mean ± SEM. ∗p < 0.05, ∗∗p < 0.01, ∗∗∗p < 0.001, vehicle versus sham; #p < 0.05, ##p < 0.01, ###p < 0.001, ABT-263 versus vehicle. |