
Fig. 1
- ID
- ZDB-FIG-220224-35
- Publication
- Paramos-de-Carvalho et al., 2021 - Targeting senescent cells improves functional recovery after spinal cord injury
- Other Figures
- All Figure Page
- Back to All Figure Page
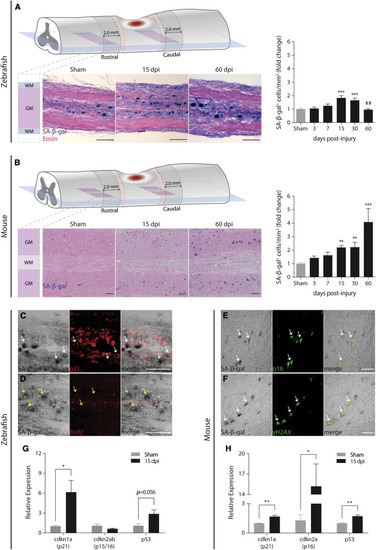
Different senescent cell dynamics are induced after spinal cord injury in zebrafish and in mice (A and B) SA-β-gal+ cells (blue) were detected and quantified in non-injured (sham) and injured zebrafish spinal cords at different time points (3, 7, 15, 30, and 60 days post-injury [dpi]). n = 5–16. Similarly, SA-β-gal+ cells were detected and quantified in mouse laminectomized (sham) and injured spinal cords at the same time points. n = 4–16. Eosin counterstaining was performed after cryosectioning. Cells were quantified at the lesion periphery along 2.0 mm in longitudinal sections spanning the ventral horn. A 0.5-mm interval (red dashed zone) was established between the lesion border and the beginning of the quantification region. SA-β-gal+ cells were only quantified in the gray matter (GM) and not in the white matter (WM). Quantifications are presented as fold change toward sham. In zebrafish, SA-β-gal+ cells reach a peak at 15 dpi (238.6 cells/mm2), a 2-fold increase compared to sham (127.2 cells/mm2). In mice, SA-β-gal+ cells display a 4-fold increase at 60 dpi (80.0 cells/mm2) toward sham (19.0 cells/mm2). Data are presented as mean ± SEM. ∗p < 0.05, ∗∗p < 0.01, ∗∗∗p < 0.001, versus sham; ##p < 0.01, 60 versus 30 dpi. Scale bars, 100 μm. (C and D) In zebrafish, SA-β-gal+ cells co-localized with the senescence biomarker p21 and were devoid of the proliferation marker BrdU. Images were taken at 15 dpi. White arrows point to representative examples of co-localization, while yellow arrows point to the absence of co-localization. Scale bars, 100 μm. (E and F) In mice, a similar co-localization was found between SA-β-gal+ cells and the senescence biomarkers p16 and γH2AX. White arrows point to representative examples of co-localization. Scale bars, 100 μm. (G and H) At 15 dpi, the expression of senescence biomarkers, namely cdkn1a (encodes for p21), cdkn2ab (encodes for p15/16 in zebrafish), cdkn2a (encodes for p16 in mice), and p53, was evaluated by qPCR. Results are presented as relative expression toward sham. Data are presented as mean ± SEM. ∗p < 0.05, ∗∗p < 0.01, versus sham. |