
Fig. 2
- ID
- ZDB-FIG-220224-36
- Publication
- Paramos-de-Carvalho et al., 2021 - Targeting senescent cells improves functional recovery after spinal cord injury
- Other Figures
- All Figure Page
- Back to All Figure Page
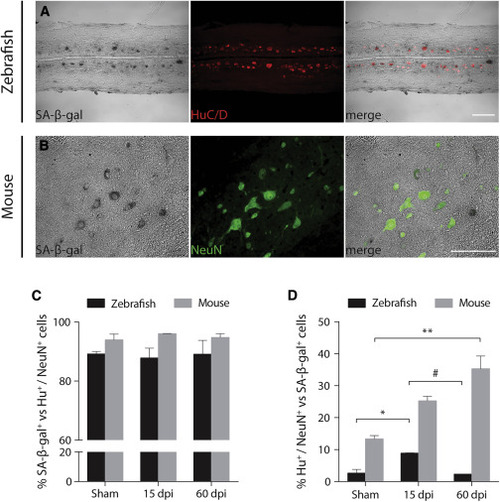
Different profiles of SA-β-gal+ neuronal populations between zebrafish and mouse (A and B) In zebrafish and mice, SA-β-gal+ cells (black) co-localized with the neuronal markers (A) HuC/D (red) and (B) NeuN (green), respectively. Representative images were taken at 15 days post-injury (dpi). Scale bars, 100 μm. (C and D) Percentages of total SA-β-gal+ cells that are HuC/D+ or NeuN+ and of total HuC/D+ or NeuN+ neurons that are SA-β-gal+ are compared between both models. Cells were quantified at the lesion periphery along 2.0 mm in longitudinal sections. A 0.5-mm interval was established between the lesion border and the beginning of the quantification region. Quantifications are presented for uninjured/laminectomized (sham) zebrafish/mice at 15 and 60 dpi. n = 2–4. Data are presented as mean ± SEM. ∗p < 0.05, ∗∗p < 0.01, versus sham; #p < 0.05, versus 15 dpi. |