
- Title
-
Chordacentrum mineralization is delayed in zebrafish betaglycan-null mutants
- Authors
- Molina-Villa, T., Ramírez-Vidal, L., Mendoza, V., Escalante-Alcalde, D., López-Casillas, F.
- Source
- Full text @ Dev. Dyn.
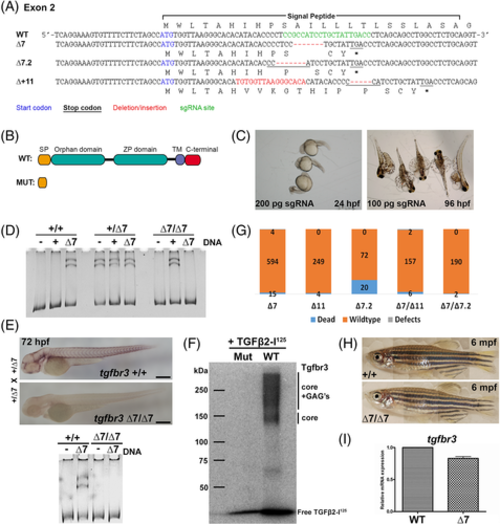
Zebrafish tgfbr3 null mutants survive to adulthood. A, Exon 2 sequence from wild type and loss of function Tgfbr3 mutant alleles (WT, ∆7, ∆7.2, ∆ + 11). Highlighted are the translation start codon (blue), Cas9 target sequence (green), deletion/insertion sequence in mutant alleles (red) and novel in frame stop codon (underlined, *). B, Scheme comparing the structural domains encoded in the tgfbr3 WT allele vs the predicted tgfbr3 mutant alleles. C, Representative images of defective crispant embryos obtained by the injection of 100 pg of sgRNA at 96 hpf and 200 pg at 24 hpf. D, Representative image of a polyacrylamide gel showing embryos genotyping. Exon 2 amplicons derived from the DNA to be genotyped DNA were mixed with exon 2 probing amplicons of known sequence, + for WT, ∆7 for mutant allele, − for control test without probing amplicon. The presence of migration-retarded heteroduplex complexes (doublet near loading well) is observed only when a discordant WT or ∆7 probing DNA is added to the annealing mix. The heterozygous samples yield these duplexes even in the absence of added probes (−). E, Tgfbr3 immunohistochemistry of WT (tgfbr3 +/+) or null mutant (tgfbr3 ∆7/∆7) 72 hpf embryos obtained from heterozygous parents (WT/∆7) intercrosses. Genotyping (lower panel) of these specimens corroborated their allele identity. F, Endogenous Tgfbr3 was revealed by crosslinking to Tgfb2-I125 in the AFLIP experiment done with protein extracts from tgfbr3 +/+ (WT) embryos but not with protein extracts from tgfbr3 ∆7/∆7 (Mut) embryos. G, Quantitation of malformed embryos from mutant homozygous parents for the 3 different alleles, alone or combined, showing no defects in embryos at 72 hpf. H, Image of 6-month-old WT (tgfbr3 +/+) and null (tgfbr3 ∆7/∆7) specimens did not reveal any major morphological defects. I, Relative expression of tgfbr3 mRNA by RT-qPCR in WT and mutant (tgfbr3 ∆7/∆7) total RNA purified from 7 dpf embryos EXPRESSION / LABELING:
PHENOTYPE:
|

tgfbr3-null mutant embryos do not exhibit angiogenic defects. A, WT (tgfbr3 +/+) and null ∆7 mutant (tgfbr3 ∆7/∆7) embryos, in the fli1:EGFP background, from 48 hpf embryos were immunoflorescently stained for Tgfbr3. Confocal images of these specimen revealed no IVS (intersegmental vessels) migration defects in null embryos. B, Aorta and ISV diameter measurements showed no difference between WT and ∆7 embryos at 48 hpf embryos. Two-tailed Student's t-test was performed, and P values are shown. C, Confocal images of WT and ∆7 adult heart ventricles (V) showed normal distribution of coronary vessels. The identity of these specimens was verified by genotyping as described in Figure 1. D, Using embryos obtained from homozygous crosses of WT (tgfbr3 +/+) or null ∆7 mutant (tgfbr3 ∆7/∆7) fishes, were subjected to knock down experiments with 7 ng of the splicing blocking morpholino (Mo-BG02) or the mismatched control morpholino. Embryos were injected at 1 cell stage and their malformations was analyzed and scored at 48 hpf. Mutant embryos did not show resistance to morpholino effects. E, WT and ∆7 at single cell-stage embryos (in a fli1:EGFP background) were microinjected with 2 ng of Mo-BG02 or control morpholino; subtle vascular defects in the formation of the parachordal lymphatic endothelial cells (LEC) were observed in both WT and ∆7 embryos injected with Mo-BG02, Scale bar: 200 μm |
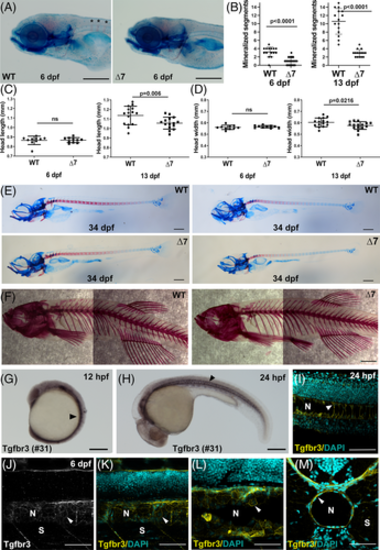
Tgfbr3 is expressed in the notochord and its absence results in chordacentra mineralization delay. A, WT (tgfbr3 +/+) and null ∆7 mutant (tgfbr3 ∆7/∆7) 6 dpf embryos were stained with alizarin red and alcian blue to label bone and cartilage. Asterisks mark notochord mineralized segments (red stripes). Mineralized segments (B), head length (C), and head width (D) were quantized in WT and ∆7 embryos at 6 and 13 dpf. Two-tailed Student's t-test was performed, and P values are shown. E, Bone and Cartilage staining of 34 dpf larvae. Two representative images of different length WT and Mutant larvae shows delayed mineralization in mutant larvae. F, Alizarin red staining of 1 year WT and ∆7 fishes showing normal skeletons. G-M, Tgfbr3 expression in the developing notochord. Whole mount IHC of 12 hpf (G) and 24 hpf (H) embryos reveal positive staining for Tgfbr3 in axial mesoderm and developing notochord, and in notochord, respectively (arrowheads). IF images of 24 hpf (L, cryosection) and 6 dpf (J and K, wholemount and L and M, cryosections) embryos revealed Tgfbr3 expression in the membranes of vacuolated notochordal inner cells and in the membranes of outer sheath cells (arrowheads). Somite (S), notochord (N), scale bar in A, F, G, and H: 200 μm, in E, I-M: 100 μm EXPRESSION / LABELING:
|
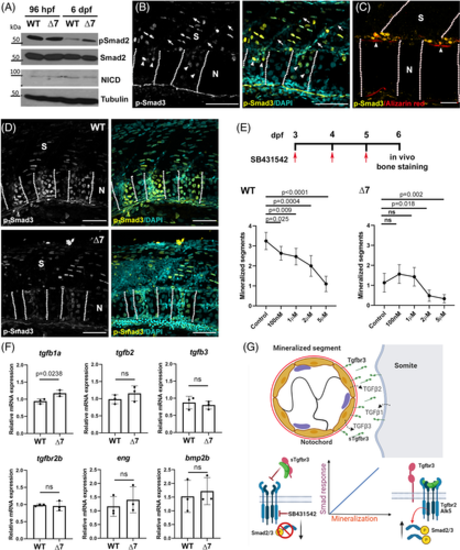
TGFβ participates in chordacentra mineralization. A, Western blots of phospho-Smad2, total Smad2 and NICD were used to determine TGFβ and Notch activation. Total protein extracts obtained the posterior trunks of WT (tgfbr3 +/+) and mutant (tgfbr3 ∆7/∆7) embryos at 96 hpf and 6 dpf and were analyzed. Total Smad2 and α-tubulin were used as loading controls. B, pSmad3 IF in longitudinal cryosection from 6dpf WT embryos; positive nuclei (arrowhead), and somite boundary limit (arrow) are indicated. Image shows region between the fourth and sixth somites. C, Colocalization of pSmad3 positive nuclei and mineralized notochord segments (alizarin red, arrowhead). Dotted lines show boundaries between somites and notochordal mineralized segments. D, pSmad3 detection in WT (tgfbr3 +/+) and null ∆7 mutant (tgfbr3 ∆7/∆7) 6 dpf larvae showing a TGFβ signaling decrease in notochord of tgfbr3-null specimens. Images were taken between the third and sixth somites. E, Pharmacological inhibition of TGFβ signaling with SB431542 for 72 hours. Graphs show mean of mineralized segments determined from 30 embryos at each dose point. Two-tailed Student's t-test was performed, and P values are shown (F). Quantitative expression of TGFβ ligands and receptors mRNAs in total RNA prepared from 6dpf WT (tgfbr3 +/+) and null ∆7 mutant (tgfbr3 ∆7/∆7) embryos' posterior trunk. Data from three independent experiments, p was calculated by Student's t statistical test. G, To summarize our data, we propose a model in which TGFβ contributes to chordacentra mineralization with a significant assistance of the Tgfbr3 well-established ligand-presentation function. The elimination of Tgfbr3, therefore, results in a decrease of the TGFβ signaling required for the correct timing of chordacentra mineralization. Notochord (N), somite (S). Scale bar: B, 200 μm; C, 50 μm, and D, 100 μm |