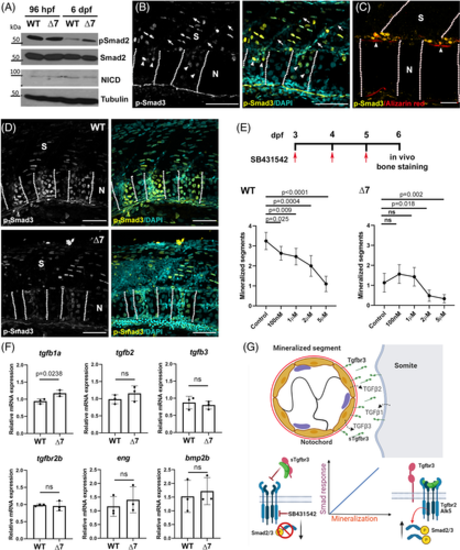
TGFβ participates in chordacentra mineralization. A, Western blots of phospho-Smad2, total Smad2 and NICD were used to determine TGFβ and Notch activation. Total protein extracts obtained the posterior trunks of WT (tgfbr3 +/+) and mutant (tgfbr3 ∆7/∆7) embryos at 96 hpf and 6 dpf and were analyzed. Total Smad2 and α-tubulin were used as loading controls. B, pSmad3 IF in longitudinal cryosection from 6dpf WT embryos; positive nuclei (arrowhead), and somite boundary limit (arrow) are indicated. Image shows region between the fourth and sixth somites. C, Colocalization of pSmad3 positive nuclei and mineralized notochord segments (alizarin red, arrowhead). Dotted lines show boundaries between somites and notochordal mineralized segments. D, pSmad3 detection in WT (tgfbr3 +/+) and null ∆7 mutant (tgfbr3 ∆7/∆7) 6 dpf larvae showing a TGFβ signaling decrease in notochord of tgfbr3-null specimens. Images were taken between the third and sixth somites. E, Pharmacological inhibition of TGFβ signaling with SB431542 for 72 hours. Graphs show mean of mineralized segments determined from 30 embryos at each dose point. Two-tailed Student's t-test was performed, and P values are shown (F). Quantitative expression of TGFβ ligands and receptors mRNAs in total RNA prepared from 6dpf WT (tgfbr3 +/+) and null ∆7 mutant (tgfbr3 ∆7/∆7) embryos' posterior trunk. Data from three independent experiments, p was calculated by Student's t statistical test. G, To summarize our data, we propose a model in which TGFβ contributes to chordacentra mineralization with a significant assistance of the Tgfbr3 well-established ligand-presentation function. The elimination of Tgfbr3, therefore, results in a decrease of the TGFβ signaling required for the correct timing of chordacentra mineralization. Notochord (N), somite (S). Scale bar: B, 200 μm; C, 50 μm, and D, 100 μm
|
