
- Title
-
Kaempferol-3-O-Glucuronide Ameliorates Non-Alcoholic Steatohepatitis in High-Cholesterol-Diet-Induced Larval Zebrafish and HepG2 Cell Models via Regulating Oxidation Stress
- Authors
- Deng, Y., Ma, J., Weng, X., Wang, Y., Li, M., Yang, T., Dou, Z., Yin, Z., Shang, J.
- Source
- Full text @ Life (Basel)
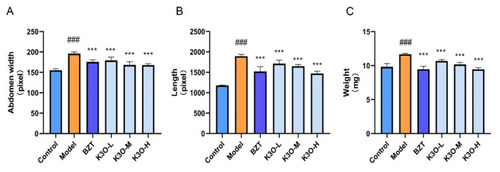
Effect of K3O on the body size of HCD-induced larval zebrafish. (A) Abdomen width of larval zebrafish. (B) Length of larval zebrafish. (C) Weight of larval zebrafish livers. The bars indicate mean ± SD. n.s. p > 0.05; # p < 0.05, ## p < 0.01, ### p < 0.001 represent the difference in significance compared with control; p > 0.05, * p < 0.05, ** p < 0.01, and *** p < 0.001 represent the difference in significance compared with model, p < 0.05 was considered to be statistically significant. Significance was calculated by ANOVA followed by Turkey’s test (n = 10 for A–C). PHENOTYPE:
|
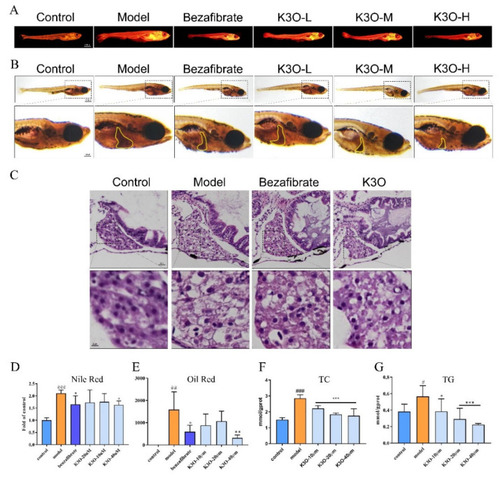
Effect of K3O on the lipid accumulation of HCD-induced larval zebrafish. (A) Nile red stain of larval zebrafish. (B) Oil Red stain of larval zebrafish; the hepatic steatosis is indicated by the yellow circle. (C) HE stains of larval zebrafish livers. (D) Quantitation of Nile red stain. (E) Quantitation of Oil Red stain. (F) TC level of larval zebrafish. (G) TG level of larval zebrafish. The bars indicate mean ± SD. n.s. p > 0.05; # p < 0.05, ## p < 0.01, ### p < 0.001 represent the difference of significance compared with control; * p < 0.05, ** p < 0.01, and *** p < 0.001 represent the difference of significance compared with model, p < 0.05 was considered to be statistically significant. Significance was calculated by ANOVA followed by a Turkey’s test (n = 10 for D and E; n = 18 in three separate runs for F and G). PHENOTYPE:
|
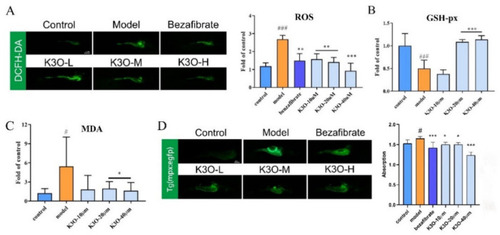
Effect of K3O on the oxidation and inflammation of HCD-induced larval zebrafish. (A) ROS of larval zebrafish stained by DCFH-DA and quantification. (B) GSH-px level of larval zebrafish. (C) MDA level of larval zebrafish. (D) Tg (mpx: EGFP) zebrafish captured by a fluorescence stereoscope and fluorescence intensity quantification. The bars indicate mean ± SD. n.s. p > 0.05; # p < 0.05, ## p < 0.01, ### p < 0.001 represent the difference of significance compared with control; * p < 0.05, ** p < 0.01, and *** p < 0.001 represent the difference of significance compared with model, p < 0.05 was considered to be statistically significant. Significance was calculated by ANOVA followed by a Turkey’s test (n = 10 for A and D; n = 18 in three separate runs for B and C). EXPRESSION / LABELING:
PHENOTYPE:
|

Effect of K3O on FFA-induced HepG2 cell line. (A) Oil Red stain of HepG2. (B) DHE stain of HepG2. (C) HepG2 cell viability of K3O detected by MTT. (D) H2O2-induced HepG2 cell viability of K3O detected by MTT. (E) GSH-px level of HepG2. (F) MDA level of HepG2. The bars indicate mean ± SD. n.s. p > 0.05; # p < 0.05, ## p < 0.01, ### p < 0.001 represent the difference of significance compared with control; * p < 0.05, ** p < 0.01, and *** p < 0.001 represent the difference of significance compared with model, p < 0.05 was considered to be statistically significant. Significance was calculated by ANOVA followed by a Turkey’s test (n = 18 in three separate runs for C and D; n = 3 in three separate runs for E and F). |
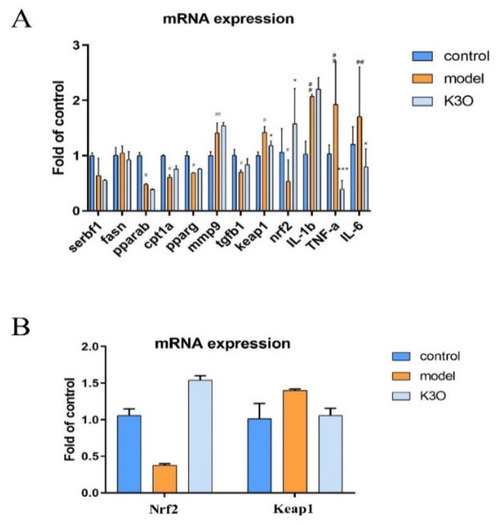
mRNA expression effect of K3O. ( EXPRESSION / LABELING:
PHENOTYPE:
|