|
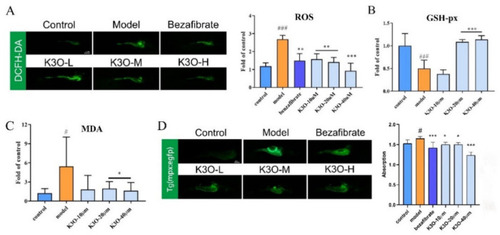
Effect of K3O on the oxidation and inflammation of HCD-induced larval zebrafish. (A) ROS of larval zebrafish stained by DCFH-DA and quantification. (B) GSH-px level of larval zebrafish. (C) MDA level of larval zebrafish. (D) Tg (mpx: EGFP) zebrafish captured by a fluorescence stereoscope and fluorescence intensity quantification. The bars indicate mean ± SD. n.s. p > 0.05; # p < 0.05, ## p < 0.01, ### p < 0.001 represent the difference of significance compared with control; * p < 0.05, ** p < 0.01, and *** p < 0.001 represent the difference of significance compared with model, p < 0.05 was considered to be statistically significant. Significance was calculated by ANOVA followed by a Turkey’s test (n = 10 for A and D; n = 18 in three separate runs for B and C).
|