
IMAGE
Figure 1
- ID
- ZDB-IMAGE-210606-3
- Publication
- Deng et al., 2021 - Kaempferol-3-O-Glucuronide Ameliorates Non-Alcoholic Steatohepatitis in High-Cholesterol-Diet-Induced Larval Zebrafish and HepG2 Cell Models via Regulating Oxidation Stress
- All Figures
- Figures for Deng et al., 2021
Image
|
Figure Caption
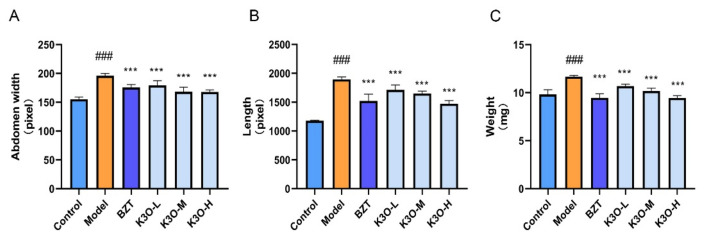
Figure 1 Effect of K3O on the body size of HCD-induced larval zebrafish. (A) Abdomen width of larval zebrafish. (B) Length of larval zebrafish. (C) Weight of larval zebrafish livers. The bars indicate mean ± SD. n.s. p > 0.05; # p < 0.05, ## p < 0.01, ### p < 0.001 represent the difference in significance compared with control; p > 0.05, * p < 0.05, ** p < 0.01, and *** p < 0.001 represent the difference in significance compared with model, p < 0.05 was considered to be statistically significant. Significance was calculated by ANOVA followed by Turkey’s test (n = 10 for A–C).
Figure Data
Acknowledgments
This image is the copyrighted work of the attributed author or publisher, and
ZFIN has permission only to display this image to its users.
Additional permissions should be obtained from the applicable author or publisher of the image.
Full text @ Life (Basel)