
Figure 4
- ID
- ZDB-IMAGE-210606-6
- Publication
- Deng et al., 2021 - Kaempferol-3-O-Glucuronide Ameliorates Non-Alcoholic Steatohepatitis in High-Cholesterol-Diet-Induced Larval Zebrafish and HepG2 Cell Models via Regulating Oxidation Stress
- All Figures
- Figures for Deng et al., 2021
|
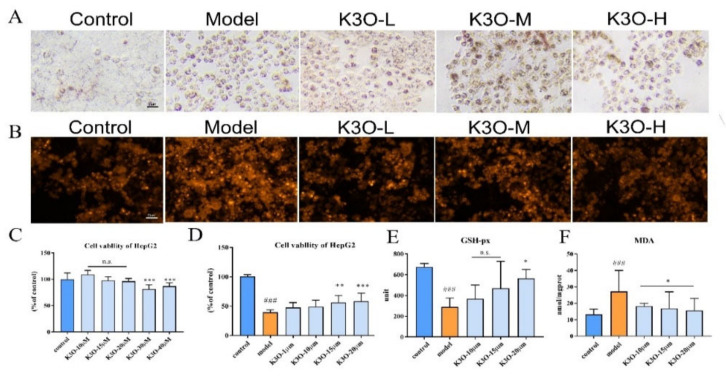
Figure 4 Effect of K3O on FFA-induced HepG2 cell line. (A) Oil Red stain of HepG2. (B) DHE stain of HepG2. (C) HepG2 cell viability of K3O detected by MTT. (D) H2O2-induced HepG2 cell viability of K3O detected by MTT. (E) GSH-px level of HepG2. (F) MDA level of HepG2. The bars indicate mean ± SD. n.s. p > 0.05; # p < 0.05, ## p < 0.01, ### p < 0.001 represent the difference of significance compared with control; * p < 0.05, ** p < 0.01, and *** p < 0.001 represent the difference of significance compared with model, p < 0.05 was considered to be statistically significant. Significance was calculated by ANOVA followed by a Turkey’s test (n = 18 in three separate runs for C and D; n = 3 in three separate runs for E and F).