|
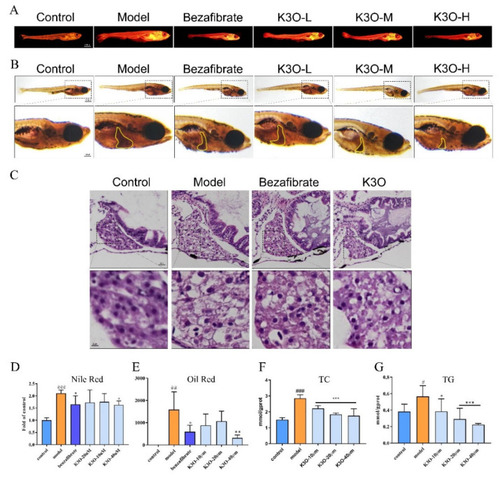
Effect of K3O on the lipid accumulation of HCD-induced larval zebrafish. (A) Nile red stain of larval zebrafish. (B) Oil Red stain of larval zebrafish; the hepatic steatosis is indicated by the yellow circle. (C) HE stains of larval zebrafish livers. (D) Quantitation of Nile red stain. (E) Quantitation of Oil Red stain. (F) TC level of larval zebrafish. (G) TG level of larval zebrafish. The bars indicate mean ± SD. n.s. p > 0.05; # p < 0.05, ## p < 0.01, ### p < 0.001 represent the difference of significance compared with control; * p < 0.05, ** p < 0.01, and *** p < 0.001 represent the difference of significance compared with model, p < 0.05 was considered to be statistically significant. Significance was calculated by ANOVA followed by a Turkey’s test (n = 10 for D and E; n = 18 in three separate runs for F and G).
|