
- Title
-
Sensory adaptation at ribbon synapses in the zebrafish lateral line
- Authors
- De Faveri, F., Marcotti, W., Ceriani, F.
- Source
- Full text @ J. Physiol.
|
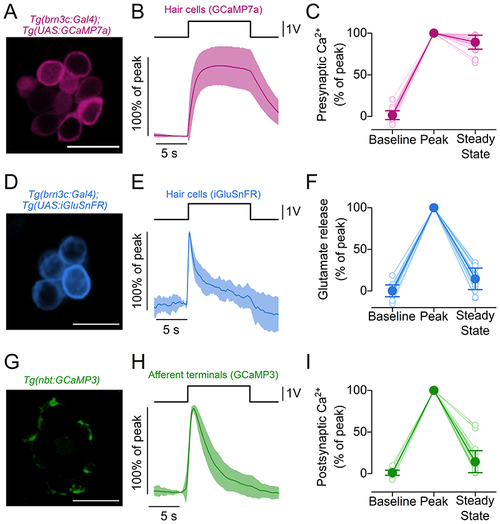
A, maximal projection image of a neuromast expressing the fluorescent Ca2+ reporter GCaMP7a in hair cells. Scale bar = 10 μm. B, average Ca2+ changes in hair cells measured as changes in GCaMP7a fluorescence emission. Hair cell bundles were deflected by a 10 s saturating stimulus in the excitatory direction. C, presynaptic Ca2+ changes normalised to the maximum GCaMP7a ΔF/F0 obtained during the first 2 s of the stimulus (Peak). Baseline: average ΔF/F0 before stimulation. Steady State: average ΔF/F0 in the last 5 s of the stimulus. N = 39 hair cells from 18 neuromasts (4 zebrafish). D, maximal projection image of a neuromast expressing the fluorescent glutamate reporter iGluSnFR in hair cells. Scale bar = 10 μm. E, average traces displaying the time course of glutamate release from the hair cells detected by iGluSnFR during the 10 s stimulus. F, glutamate release normalised to the Peak of the responses. Baseline, Steady State and Peak are computed as in (C). N = 21 hair cells from 15 neuromasts (7 zebrafish). G, maximal projection image of a neuromast expressing the fluorescent Ca2+ reporter GCaMP3 in postsynaptic terminals. Scale bar = 10 μm. H, average postsynaptic Ca2+ responses measured as changes in GCaMP3 fluorescence during the excitatory bundle displacement. I, postsynaptic Ca2+ responses normalised to the Peak of the response. Baseline, Steady State and Peak are computed as in (C). N = 33 afferent terminals from 17 neuromasts (5 zebrafish). In (B), (E) and (H), continuous traces represent the mean values and the shaded area indicates the SD. Open and filled symbols in (C), (F) and (I) represent individual recordings and average values, respectively. |
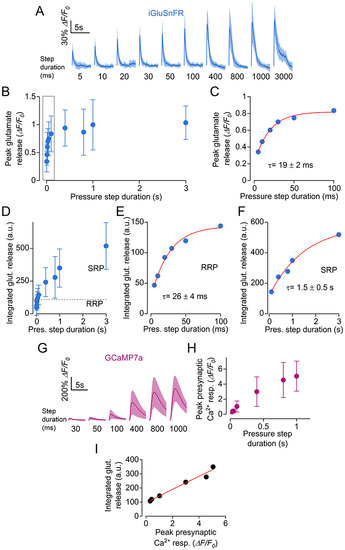
A, average traces displaying the time course of glutamate release in hair cells detected as changes in iGluSnFR fluorescence emission during fluid jet stimulation with steps of increasing duration, which is indicated below each trace. Number of hair cells from left to right: 14, 15, 14, 13, 16, 16, 16, 17, 17, 11 (18 neuromasts from 10 zebrafish). Continuous line: mean data; shaded area: SD. B, peak glutamate release as a function of step duration. C, expanded view of peak glutamate release from (B) (first 100 ms). The peak glutamate release was fitted by a single exponential with τ = 19 ± 2 ms. D, time integral of iGluSnFR fluorescence traces, indicating the total glutamate release as a function of step duration. E and F, expanded view of integrated glutamate release for step durations up to 100 ms (E, exponential fit: τ = 26 ± 4 ms) and between 200 ms and 3000 ms (F, exponential fit: τ = 1.5 ± 0.5 s). G, average GCaMP7a responses in hair cells to stimuli of indicated duration. Number of hair cells from left to right: 10, 14, 15, 15, 15, 15 (13 neuromasts from 5 zebrafish). Continuous line: mean data; shaded area: SD. H, peak presynaptic Ca2+ response as a function of step duration. I, integrated glutamate release as a function of peak Ca2+ response. Pooled data from (F) and (H). Data were fitted with the equation: urn:x-wiley:00223751:media:tjp14725:tjp14725-math-0005 which returned a coefficient n = 0.967 ± 0.255, indicating a quasi-linear dependence between neurotransmitter release and Ca2+ influx. For the individual recordings used to calculate the averages shown in (B) to (F), (H) and (I), see Supporting Information - Expanded dataset (Fig. 3). |
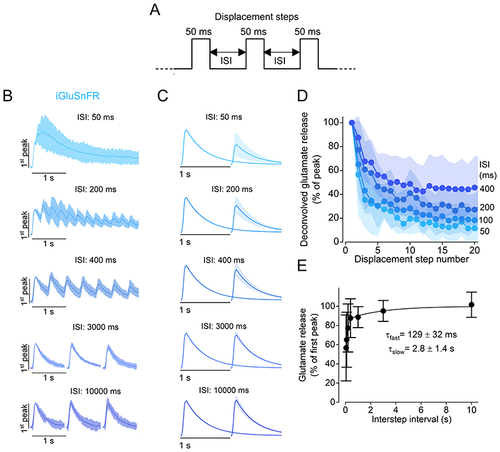
A, schematic representation of the stimulus protocol used to displace the cupula of the neuromasts towards the excitatory direction. Step displacements of 50 ms in duration, which saturated the fast glutamate response, were delivered with varying ISIs. B, average iGluSnFR responses to a train of steps with different ISIs. Traces are normalised to the peak response of the first step. Note that, for longer ISIs (3000 ms and 10 000 ms), image acquisition was interrupted in-between steps to limit photobleaching. C, deconvolved glutamate responses to paired pulses for different ISIs (see Methods). Individual traces were normalised to the amplitude of the response elicited by the first displacement step. In (B) and (C), continuous lines indicate the mean value and the shaded area indicates the SD. D, glutamate release (normalised peak) plotted as a function of pressure step number for the ISIs indicated on the right. E, time course of the recovery of the fast component of release. Peak glutamate release measured at the second displacement step as a function of ISI. The individual data points were fitted with a double exponential function: urn:x-wiley:00223751:media:tjp14725:tjp14725-math-0006, with urn:x-wiley:00223751:media:tjp14725:tjp14725-math-0007. Number of hair cells: 10 (50 and 100 ms), 11 (400 ms), 12 (200 ms, 1 and 10 s), 15 (3 s). Data are from 33 neuromasts (16 zebrafish). For the individual recordings used to calculate the averages shown in (D) and (E), see Supporting Information - Expanded dataset (Fig. 4). |
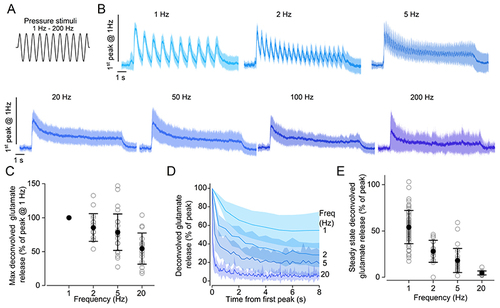
A, schematic representation showing the 10 s long sine wave stimulus used to displace the cupula of the neuromasts with the fluid jet. The frequencies of the sine wave stimuli were: 1, 2, 5, 20, 50, 100 and 200 Hz. B, average iGluSnFR responses (continuous line: mean, shaded area: SD) recorded in lateral line hair cells using a sine wave stimulus with the above frequencies. To compare responses to different frequencies, fluorescence traces were normalised to the peak of the response to 1 Hz stimulation. Responses from hair cells with different direction of sensitivity were aligned by shifting the response to one direction by half of the period of the stimulation. C, maximum glutamate release as a function of the stimulation frequency from 1 Hz to 20 Hz. This analysis was limited to lower frequencies because it was not possible to reliably obtain deconvolved responses from higher frequency stimulations. Responses are normalised to the peak of the response to 1 Hz stimulation. D, peak glutamate release at each stimulation cycle, as a function of time. The frequency of the stimulus is indicated on the right. Traces are normalised to the peak for each stimulation frequency. The time course of glutamate release could be fitted by a single exponential function at 1 and 2 Hz (1 Hz: τ = 1.4 ± 0.1 s; 2 Hz: τ = 1.0 ± 0.1 s) and a double exponential function at 5 and 20 Hz (5 Hz: τfast = 0.1 ± 0.01 s, τslow = 1.5 ± 0.1 s; 20 Hz: τfast = 0.04 ± 0.01 s, τslow = 1.0 ± 0.1 s). E, steady state glutamate release as a function of stimulation frequency. Traces are normalised to the peak for each stimulation frequency. Glutamate responses in (C) to (E) were computed by deconvolution of the iGluSnFR fluorescence traces as indicated in Fig. 4 (see also Methods). Number of hair cells: 57 (1 Hz), 17 (2 Hz), 28 (5 Hz), 19 (20 Hz), 21 (50 Hz), 20 (100 Hz), 11 (200 Hz). Data are from 56 neuromasts (18 zebrafish). For the individual recordings used to calculate the averages shown in (D), see Supporting Information - Expanded dataset (Fig. 5). |
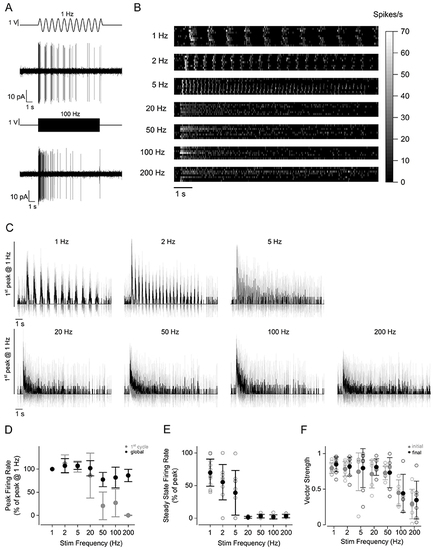
A, representative recordings of firing activity from a PLLg neuron during the stimulation of the cupula with a sine wave at 1 Hz (top) and 100 Hz (bottom). B, raster plot of individual afferent neuron activity during the application of 10 s stimuli. The stimulation frequency is indicated on the left. The firing rate was calculated by convolving the spike train with a Gaussian kernel (σ = 5 ms). Of the 11 afferent neuron recordings, 1 showed no firing activity after the initial peak for all the frequencies tested. C, average firing rate (continuous trace: mean; shaded area: SD) of PLLg afferent neurons during the application of periodic stimuli to a connected neuromast. Traces are normalised to the peak of the response to 1 Hz stimulation. D, peak firing rate during the first excitatory half-cycle (grey symbols) and during the entire stimulation (black symbols). Responses are normalised to the peak of the response to 1 Hz stimulation. E, steady state firing rate as a function of stimulation frequency. Responses are normalised to the peak for each stimulation frequency. The steady state was calculated as the peak firing rate during the last stimulation cycle for frequencies below 5 Hz included, and as the average firing rate in the last 500 ms of stimulation for frequencies higher than 5 Hz. F, vector strength values as a function of stimulation frequency. Values were computed in two 3 s long time windows at the beginning (grey symbols) and at the end (black symbols) of the stimulation. Note that a subset of the recordings, for which it was not possible to calculate the final vector strength because of the low number of spikes in the last 3 s of stimulation, were not included in this analysis. Number of neurons from left to right (excluded neurons in parentheses): 10 (1), 8 (1), 8 (1), 6 (2), 7 (1), 5 (2), 7 (1) from 7 zebrafish. For the individual recordings used to calculate the averages shown in (D), see Supporting Information - Expanded dataset (Fig. 6). |
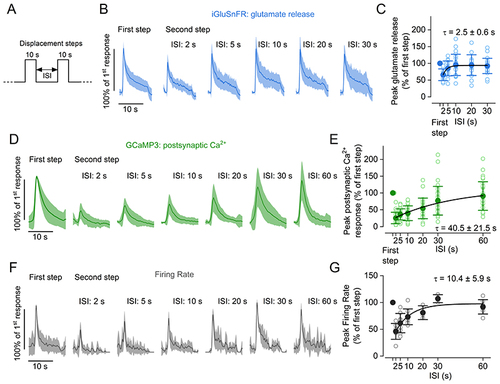
A, schematic representation of the experimental protocol used to measure the time course of the recovery from adaptation of pre- and postsynaptic responses following two 10 s displacement steps with varying ISIs. B, average glutamate release detected as iGluSnFR fluorescence changes in hair cells. C, peak of the response to the second pressure step relative to the response to the first step at different ISIs. The continuous line represents an exponential fit to the data. Number of hair cells: 17 (2 and 5 s), 23 (10 s), 16 (20 s), 23 (30 s); data are from 25 neuromasts (15 zebrafish). D, average postsynaptic Ca2+ responses measured in zebrafish expressing GCaMP3 panneuronally. E, peak amplitude of the response to the second pressure step relative to the response to the first step at different ISIs. The continuous line represents an exponential fit to the data. Number of afferent terminals: 29 (2 s), 31(5 s), 33 (10 s), 25 (20 s), 35 (30 s), 29 (60 s); data are from 33 neuromasts (10 zebrafish). F, average normalised firing rate of afferent neurons. G, peak firing rate during the second pressure step relative to the first step at different ISIs. The continuous line represents an exponential fit to the data. Number of neurons: 7 (2 s), 9 (5 s), 8 (10 s), 3 (20 s), 3 (30 s), 7 (30 s) from 18 zebrafish. In (B), (D) and (F), responses are normalised to the maximum amplitude of the response to the first step. Continuous traces represent the mean values and the shaded area indicates the SD. In (C), (E) and (G), filled and open symbols denote average values and individual recordings, respectively, and continuous lines represent a fit to the data with the function urn:x-wiley:00223751:media:tjp14725:tjp14725-math-0008. |
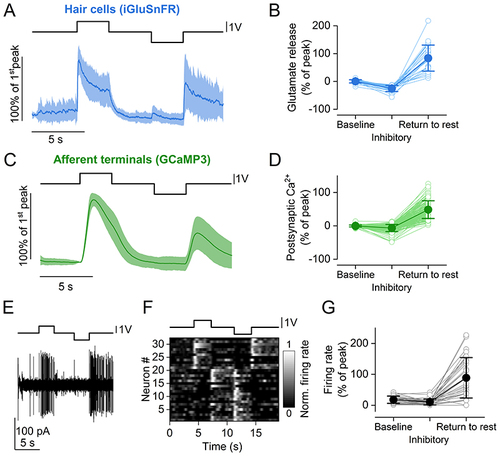
A, average time course of iGluSnFR responses to two consecutive saturating stimuli (duration: 3s) in opposite directions (excitatory and inhibitory) from 26 hair cells (23 neuromasts, 15 zebrafish). Top trace: fluid jet driving voltage. B, glutamate release at three different time points of the stimulus. Values are normalised to the maximum response calculated during the first 2 s of the stimulus (Peak). Baseline: average ΔF/F0 before stimulation. Inhibitory: minimum ΔF/F0 during the inhibitory step. Return to rest: maximum ΔF/F0 in the 3 s after the termination of the inhibitory stimulation. The return to rest response was visible in the majority of hair cells tested (26 out of 28 hair cells). C, average trace of postsynaptic Ca2+ responses to two 3 s saturating stimuli in opposite directions (excitatory and inhibitory) detected as change in GCaMP3 fluorescence emission from 143 afferent terminals (69 neuromasts, 35 zebrafish). D, postsynaptic Ca2+ responses during the delivery of the stimulus. Values are normalised to the maximum response calculated during the first 2 s of the stimulus (Peak). Baseline, Inhibitory and Return to rest were calculated as in (B). E, representative electrophysiological recording from one afferent neuron while stimulating a connected neuromast. Note the increase in firing rate both for the positive (excitatory) pressure stimulus and at the return to rest from the negative (inhibitory) stimulus. F, raster plot of individual afferent neuron activity during the application of two 3 s saturating stimuli in opposite directions. The firing rate is normalised to the peak of the firing activity during the excitatory step and was calculated by convolving the spike train with a Gaussian kernel (σ = 200 ms). G, quantification of PLLg neuron activity during the delivery of the stimulus (32 neurons, 16 zebrafish). Values are normalised to the maximum response calculated during the first 2 s of the stimulus (Peak). Baseline, Inhibitory and Return to rest were calculated as in (B). In (A) and (C), continuous traces represent the mean and the shaded areas represent the SD. In (B), (D) and (G), filled symbols denote average values and open symbols represent individual recordings. |
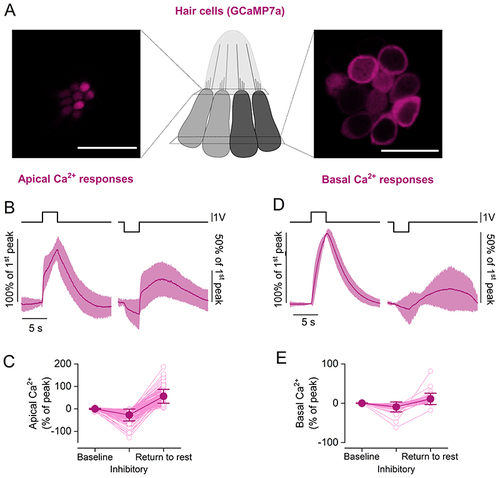
A, maximal projection images of a neuromast expressing the fluorescent Ca2+ reporter GCaMP7a in hair cells. Two focal planes are shown: the hair cell apical pole (left), where fluorescence signals largely reflect Ca2+ entry through the MET channels; hair cell basal pole (right), where fluorescence signals reflect Ca2+ entry through voltage-gated Ca2+ channels. Scale bar = 10 μm. B, average time course of intracellular Ca2+ in hair cells measured as change in GCaMP7a fluorescence at the hair cell apical pole (142 hair cells from 28 neuromasts, 8 zebrafish). Two 3 s saturating stimuli in the excitatory (left) and inhibitory (right) directions were delivered. Note the negative deflection of the intracellular Ca2+ concentration during the negative step, followed by a slow increase above baseline levels upon return to rest. C, Ca2+ changes in the hair cell apical pole during the delivery of the excitatory and inhibitory stimuli. Values are normalised to the maximum GCaMP7a signal during the excitatory step. Baseline: average ΔF/F0 before stimulation. Inhibitory: minimum ΔF/F0 during the inhibitory step. Return to rest: maximum of the response in the 12 s after the termination of the inhibitory stimulation. The return to rest response was visible in the majority of hair cells tested (142 out of 152 hair cells). D, same as in (B), but Ca2+ responses were measured at the hair cell basal (synaptic) pole (28 hair cells from 9 neuromasts, 3 zebrafish). The inhibitory displacement of the cupula caused a reduction in Ca2+ levels, followed by a positive ‘rebound’ upon returning to the rest position. E, same as in (C), but Ca2+ responses were measured at the hair cell basal (synaptic) pole. The return to rest response was visible in 28 out 45 hair cells. The top traces in (B) and (D) represent the fluid jet driving voltage. In (B) and (D), the continuous trace represents the mean values and the shaded area the SD. In (C) and (E), open symbols represent individual recordings; filled symbols denote average values. |