
Figure 5
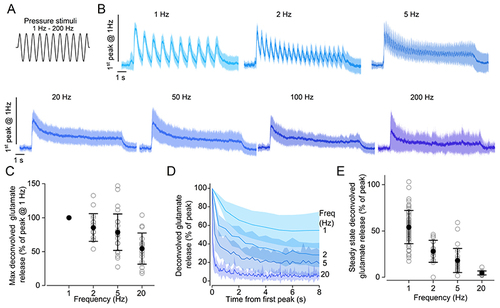
A, schematic representation showing the 10 s long sine wave stimulus used to displace the cupula of the neuromasts with the fluid jet. The frequencies of the sine wave stimuli were: 1, 2, 5, 20, 50, 100 and 200 Hz. B, average iGluSnFR responses (continuous line: mean, shaded area: SD) recorded in lateral line hair cells using a sine wave stimulus with the above frequencies. To compare responses to different frequencies, fluorescence traces were normalised to the peak of the response to 1 Hz stimulation. Responses from hair cells with different direction of sensitivity were aligned by shifting the response to one direction by half of the period of the stimulation. C, maximum glutamate release as a function of the stimulation frequency from 1 Hz to 20 Hz. This analysis was limited to lower frequencies because it was not possible to reliably obtain deconvolved responses from higher frequency stimulations. Responses are normalised to the peak of the response to 1 Hz stimulation. D, peak glutamate release at each stimulation cycle, as a function of time. The frequency of the stimulus is indicated on the right. Traces are normalised to the peak for each stimulation frequency. The time course of glutamate release could be fitted by a single exponential function at 1 and 2 Hz (1 Hz: τ = 1.4 ± 0.1 s; 2 Hz: τ = 1.0 ± 0.1 s) and a double exponential function at 5 and 20 Hz (5 Hz: τfast = 0.1 ± 0.01 s, τslow = 1.5 ± 0.1 s; 20 Hz: τfast = 0.04 ± 0.01 s, τslow = 1.0 ± 0.1 s). E, steady state glutamate release as a function of stimulation frequency. Traces are normalised to the peak for each stimulation frequency. Glutamate responses in (C) to (E) were computed by deconvolution of the iGluSnFR fluorescence traces as indicated in Fig. 4 (see also Methods). Number of hair cells: 57 (1 Hz), 17 (2 Hz), 28 (5 Hz), 19 (20 Hz), 21 (50 Hz), 20 (100 Hz), 11 (200 Hz). Data are from 56 neuromasts (18 zebrafish). For the individual recordings used to calculate the averages shown in (D), see Supporting Information - Expanded dataset (Fig. 5). |