
Figure 3
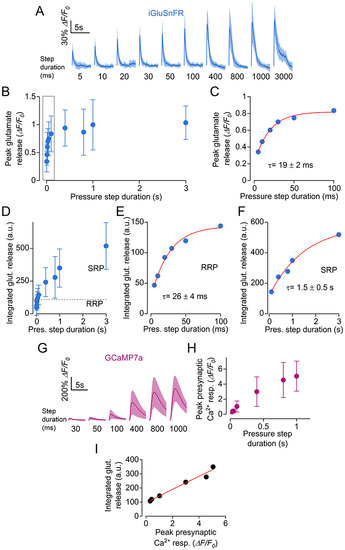
A, average traces displaying the time course of glutamate release in hair cells detected as changes in iGluSnFR fluorescence emission during fluid jet stimulation with steps of increasing duration, which is indicated below each trace. Number of hair cells from left to right: 14, 15, 14, 13, 16, 16, 16, 17, 17, 11 (18 neuromasts from 10 zebrafish). Continuous line: mean data; shaded area: SD. B, peak glutamate release as a function of step duration. C, expanded view of peak glutamate release from (B) (first 100 ms). The peak glutamate release was fitted by a single exponential with τ = 19 ± 2 ms. D, time integral of iGluSnFR fluorescence traces, indicating the total glutamate release as a function of step duration. E and F, expanded view of integrated glutamate release for step durations up to 100 ms (E, exponential fit: τ = 26 ± 4 ms) and between 200 ms and 3000 ms (F, exponential fit: τ = 1.5 ± 0.5 s). G, average GCaMP7a responses in hair cells to stimuli of indicated duration. Number of hair cells from left to right: 10, 14, 15, 15, 15, 15 (13 neuromasts from 5 zebrafish). Continuous line: mean data; shaded area: SD. H, peak presynaptic Ca2+ response as a function of step duration. I, integrated glutamate release as a function of peak Ca2+ response. Pooled data from (F) and (H). Data were fitted with the equation: urn:x-wiley:00223751:media:tjp14725:tjp14725-math-0005 which returned a coefficient n = 0.967 ± 0.255, indicating a quasi-linear dependence between neurotransmitter release and Ca2+ influx. For the individual recordings used to calculate the averages shown in (B) to (F), (H) and (I), see Supporting Information - Expanded dataset (Fig. 3). |