
|
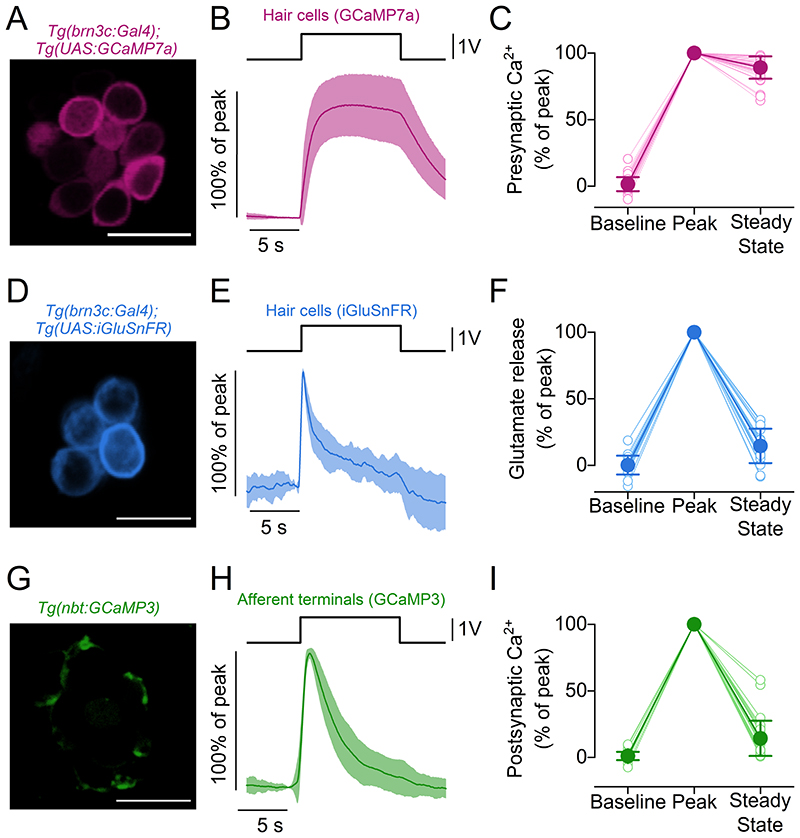
Figure 2 A, maximal projection image of a neuromast expressing the fluorescent Ca2+ reporter GCaMP7a in hair cells. Scale bar = 10 μm. B, average Ca2+ changes in hair cells measured as changes in GCaMP7a fluorescence emission. Hair cell bundles were deflected by a 10 s saturating stimulus in the excitatory direction. C, presynaptic Ca2+ changes normalised to the maximum GCaMP7a ΔF/F0 obtained during the first 2 s of the stimulus (Peak). Baseline: average ΔF/F0 before stimulation. Steady State: average ΔF/F0 in the last 5 s of the stimulus. N = 39 hair cells from 18 neuromasts (4 zebrafish). D, maximal projection image of a neuromast expressing the fluorescent glutamate reporter iGluSnFR in hair cells. Scale bar = 10 μm. E, average traces displaying the time course of glutamate release from the hair cells detected by iGluSnFR during the 10 s stimulus. F, glutamate release normalised to the Peak of the responses. Baseline, Steady State and Peak are computed as in (C). N = 21 hair cells from 15 neuromasts (7 zebrafish). G, maximal projection image of a neuromast expressing the fluorescent Ca2+ reporter GCaMP3 in postsynaptic terminals. Scale bar = 10 μm. H, average postsynaptic Ca2+ responses measured as changes in GCaMP3 fluorescence during the excitatory bundle displacement. I, postsynaptic Ca2+ responses normalised to the Peak of the response. Baseline, Steady State and Peak are computed as in (C). N = 33 afferent terminals from 17 neuromasts (5 zebrafish). In (B), (E) and (H), continuous traces represent the mean values and the shaded area indicates the SD. Open and filled symbols in (C), (F) and (I) represent individual recordings and average values, respectively.