
Figure 9
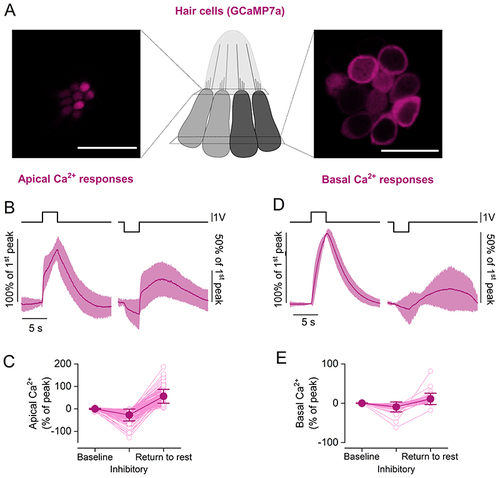
A, maximal projection images of a neuromast expressing the fluorescent Ca2+ reporter GCaMP7a in hair cells. Two focal planes are shown: the hair cell apical pole (left), where fluorescence signals largely reflect Ca2+ entry through the MET channels; hair cell basal pole (right), where fluorescence signals reflect Ca2+ entry through voltage-gated Ca2+ channels. Scale bar = 10 μm. B, average time course of intracellular Ca2+ in hair cells measured as change in GCaMP7a fluorescence at the hair cell apical pole (142 hair cells from 28 neuromasts, 8 zebrafish). Two 3 s saturating stimuli in the excitatory (left) and inhibitory (right) directions were delivered. Note the negative deflection of the intracellular Ca2+ concentration during the negative step, followed by a slow increase above baseline levels upon return to rest. C, Ca2+ changes in the hair cell apical pole during the delivery of the excitatory and inhibitory stimuli. Values are normalised to the maximum GCaMP7a signal during the excitatory step. Baseline: average ΔF/F0 before stimulation. Inhibitory: minimum ΔF/F0 during the inhibitory step. Return to rest: maximum of the response in the 12 s after the termination of the inhibitory stimulation. The return to rest response was visible in the majority of hair cells tested (142 out of 152 hair cells). D, same as in (B), but Ca2+ responses were measured at the hair cell basal (synaptic) pole (28 hair cells from 9 neuromasts, 3 zebrafish). The inhibitory displacement of the cupula caused a reduction in Ca2+ levels, followed by a positive ‘rebound’ upon returning to the rest position. E, same as in (C), but Ca2+ responses were measured at the hair cell basal (synaptic) pole. The return to rest response was visible in 28 out 45 hair cells. The top traces in (B) and (D) represent the fluid jet driving voltage. In (B) and (D), the continuous trace represents the mean values and the shaded area the SD. In (C) and (E), open symbols represent individual recordings; filled symbols denote average values. |