
Figure 7
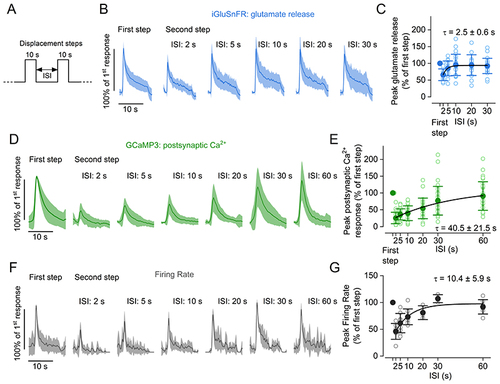
A, schematic representation of the experimental protocol used to measure the time course of the recovery from adaptation of pre- and postsynaptic responses following two 10 s displacement steps with varying ISIs. B, average glutamate release detected as iGluSnFR fluorescence changes in hair cells. C, peak of the response to the second pressure step relative to the response to the first step at different ISIs. The continuous line represents an exponential fit to the data. Number of hair cells: 17 (2 and 5 s), 23 (10 s), 16 (20 s), 23 (30 s); data are from 25 neuromasts (15 zebrafish). D, average postsynaptic Ca2+ responses measured in zebrafish expressing GCaMP3 panneuronally. E, peak amplitude of the response to the second pressure step relative to the response to the first step at different ISIs. The continuous line represents an exponential fit to the data. Number of afferent terminals: 29 (2 s), 31(5 s), 33 (10 s), 25 (20 s), 35 (30 s), 29 (60 s); data are from 33 neuromasts (10 zebrafish). F, average normalised firing rate of afferent neurons. G, peak firing rate during the second pressure step relative to the first step at different ISIs. The continuous line represents an exponential fit to the data. Number of neurons: 7 (2 s), 9 (5 s), 8 (10 s), 3 (20 s), 3 (30 s), 7 (30 s) from 18 zebrafish. In (B), (D) and (F), responses are normalised to the maximum amplitude of the response to the first step. Continuous traces represent the mean values and the shaded area indicates the SD. In (C), (E) and (G), filled and open symbols denote average values and individual recordings, respectively, and continuous lines represent a fit to the data with the function urn:x-wiley:00223751:media:tjp14725:tjp14725-math-0008. |