IMAGE

Figure 1

ID
ZDB-IMAGE-211230-87
Source
Figures for De Faveri et al., 2021
Image
Figure Caption

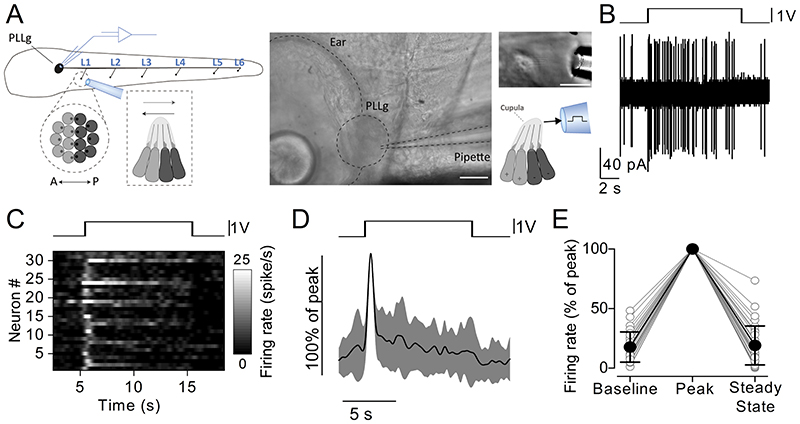
Figure 1 Firing rate adaptation in the afferent neurons during stimulation of individual neuromasts

A, Left: schematic overview of the experiment showing the tip of the fluid jet pipette stimulating the zebrafish neuromast L1 while performing loose-patch electrophysiological recordings from the posterior lateral line ganglion (PLLg). Centre: bright-field image of the PLLg, with the recording patch clamp pipette highlighted. Scale bar: 30 μm. Right: piezo-driven fluid jet displacing the cupula of a neuromast, which contains the hair bundles of the hair cells, with saturating stimuli along the anteroposterior axis of the zebrafish. Scale bar: 30 μm. B, Action potential activity from a PLLg afferent neuron while displacing the cupula of a connected neuromast with a 10 s step stimulus (drive voltage to the piezoelectric actuator is shown above the trace). Note the increased firing rate at the onset of the excitatory stimulus and its subsequent adaptation. C, Raster plot of individual afferent neuron activity during the excitatory displacement of the cupula (top: driving voltage, V). The firing rate is normalised to the peak of the firing activity (32 neurons, 29 zebrafish) and was calculated by convolving the spike train with a gaussian kernel (σ = 200 ms). D, Average normalised firing rate of the 32 recordings (solid trace: mean; shaded area: S.D.) during the step displacement (top). E, Average normalised firing rate values. Open circles represent individual recordings. Baseline: average firing rate over at least 30 s before the stimulation. Peak: maximum firing rate in the first 2 s of the stimulus. Steady State: average firing rate during the last 5 s of the stimulus. The baseline firing rate ranged from 0.1 spikes/s to 4.8 spikes/s (median: 1.8 spikes/s, mean: 2.2 spikes/s, 17.7 ± 12.6 % of the peak), while the peak ranged from 4.7 spikes/s to 56.7 spikes/s (median: 12.1 spikes/s, mean: 16.1 spikes/s). The steady state firing rate ranged from 0.0 spikes/s to 9.2 spikes/s (median: 1.9 spikes/s, mean: 2.5 spikes/s, 19.0 ± 16.4% of the peak; P < 0.0001, one-way ANOVA, 32 neurons, 29 zebrafish). Pairwise comparison revealed the peak was significantly different from the baseline (P < 0.0001) and from the steady state (P < 0.0001), while the steady state was not significantly different from the baseline (P > 0.9999, paired t tests with Bonferroni-adjusted P values).

Acknowledgments
This image is the copyrighted work of the attributed author or publisher, and ZFIN has permission only to display this image to its users. Additional permissions should be obtained from the applicable author or publisher of the image. Full text @ J. Physiol.