
- Title
-
G3BPs tether the TSC complex to lysosomes and suppress mTORC1 signaling
- Authors
- Prentzell, M.T., Rehbein, U., Cadena Sandoval, M., De Meulemeester, A.S., Baumeister, R., Brohée, L., Berdel, B., Bockwoldt, M., Carroll, B., Chowdhury, S.R., von Deimling, A., Demetriades, C., Figlia, G., Genomics England Research Consortium, de Araujo, M.E.G., Heberle, A.M., Heiland, I., Holzwarth, B., Huber, L.A., Jaworski, J., Kedra, M., Kern, K., Kopach, A., Korolchuk, V.I., van 't Land-Kuper, I., Macias, M., Nellist, M., Palm, W., Pusch, S., Ramos Pittol, J.M., Reil, M., Reintjes, A., Reuter, F., Sampson, J.R., Scheldeman, C., Siekierska, A., Stefan, E., Teleman, A.A., Thomas, L.E., Torres-Quesada, O., Trump, S., West, H.D., de Witte, P., Woltering, S., Yordanov, T.E., Zmorzynska, J., Opitz, C.A., Thedieck, K.
- Source
- Full text @ Cell
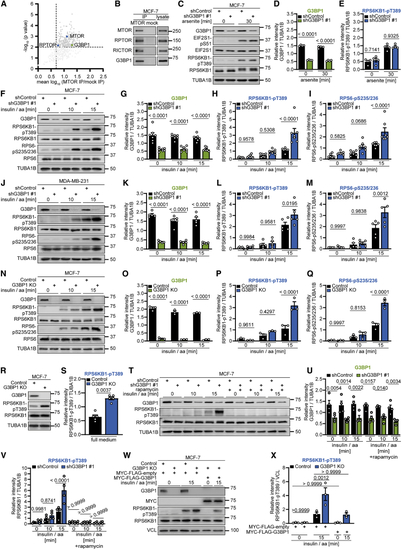
G3BP1 suppresses mTORC1 activation by insulin and nutrients (A) Re-analysis of the MTOR interactome ( (B) IP against MTOR or mock (rat immunoglobulin G [IgG]). n = 6. (C) Arsenite-treated shG3BP1 #1 cells. n = 4. (D) Quantitation of G3BP1 in (C). Shown are data points and mean ± SEM. (E) Quantitation of RPS6KB1-pT389 in (C). Data are shown as in (D). (F) Insulin and amino acid (insulin/aa)-stimulated shG3BP1 #1 cells. n = 7. (G) Quantitation of G3BP1 in (F). Shown are data points and mean ± SEM. (H) Quantitation of RPS6KB1-pT389 in (F). Data are shown as in (G). (I) Quantitation of RPS6-pS235/236 in (F). Data are shown as in (G). (J) Insulin/aa-stimulated shG3BP1 #1 cells. n = 5. (K) Quantitation of G3BP1 in (J). Shown are data points and mean ± SEM. (L) Quantitation of RPS6KB1-pT389 in (J). Data are shown as in (K). (M) Quantitation of RPS6-pS235/236 in (J). Data are shown as in (K). (N) Insulin/aa-stimulated G3BP1 KO cells. n = 3. (O) Quantitation of G3BP1 in (N). Shown are data points and mean ± SEM. (P) Quantitation of RPS6KB1-pT389 in (N). Data are shown as in (O). (Q) Quantitation of RPS6-pS235/236 in (N). Data are shown as in (O). (R) Full-medium-cultured G3BP1 KO cells. n = 5. (S) Quantitation of RPS6KB1-pT389 in (R). Shown are data points and mean ± SEM. (T) Rapamycin treatment of insulin/aa-stimulated shG3BP1 #1 cells. n = 4. (U) Quantitation of G3BP1 in (T). Shown are data points and mean ± SEM. (V) Quantitation of RPS6KB1-pT389 in (T). Data are shown as in (U). (W) Insulin/aa-stimulated G3BP1 KO cells transfected with MYC-FLAG-G3BP1 (48 h). n = 3. (X) Quantitation of RPS6KB1-pT389 in (W). Shown are data points and mean ± SEM. See also |

G3BP1 and G3BP2 suppress mTORC1 in a non-redundant manner and form a heterocomplex (A) Insulin/aa-stimulated siG3BP2 cells. n = 4. (B) Quantitation of G3BP2 in (A). Shown are data points and mean ± SEM. (C) Quantitation of RPS6KB1-pT389 in (A). Data are shown as in (B). (D) Quantitation of RPS6-pS235/236 in (A). Data are shown as in (B). (E) Serum/aa-starved G3BP1 KO cells. n = 4. (F) Quantitation of G3BP2 in (E). Shown are data points and mean ± SEM. (G) Serum/aa-starved siG3BP1 cells. n = 3. (H) Quantitation of G3BP2 in (G). Shown are data points and mean ± SEM. (I) Insulin/aa-stimulated G3BP1 KO cells transfected with MYC-FLAG-G3BP1 or MYC-FLAG-G3BP2 (48 h). n = 3. (J) Quantitation of RPS6KB1-pT389 in (I). Shown are data points and mean ± SEM. (K) IP against G3BP2 or mock (rabbit IgG). n = 2. (L) BiFC. Protein+C-terminal mLumin is indicated first; protein+N-terminal mLumin is indicated second. TL, transmitted light. Scale bar, 100 μm. n = 3. (M) Quantitation of data in (L). Shown are data points and mean ± SEM. See also |
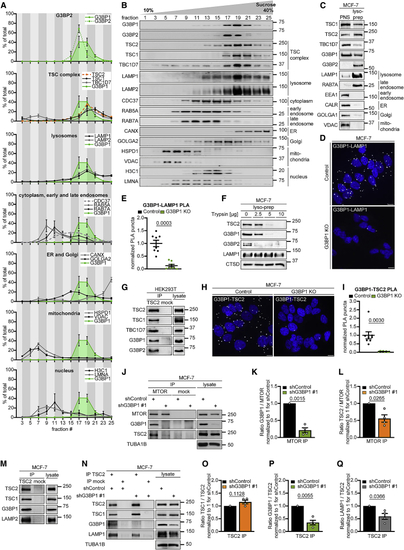
G3BP1 and G3BP2 reside at lysosomes (A) Quantitation of data in (B). G3BP1, green area. Mean ± SEM. (B) Sucrose density gradient separation of serum/aa-starved MCF-7 cells. n = 3. (C) Lyso-prep with ferromagnetic nanoparticles. PNS, postnuclear supernatant. n = 3. (D) PLA of G3BP1-LAMP1 in serum/aa-starved G3BP1 KO cells. PLA puncta, white dots; nuclei, blue (DAPI). Scale bar, 10 μm. n = 3. (E) Quantitation of data in (D). Shown are data points and mean ± SEM. n = 8 technical replicates. (F) Trypsin digest of lyso-preps prepared as in (C). n = 3 except for TSC2 (n = 2). (G) IP against TSC2 (TSC2 #1) or mock (mouse IgG). n = 3. (H) PLA of G3BP1-TSC2 in serum/aa-starved G3BP1 KO cells. PLA puncta, white dots; nuclei, blue (DAPI). Scale bar, 10 μm. n = 4. (I) Quantitation of data in (H). Shown are data points and mean ± SEM. n = 8 technical replicates. (J) IP against MTOR or mock (rat IgG); insulin/aa-stimulated shG3BP1 #1 cells (15 min). n = 4. (K) Quantitation of G3BP1 in (J). Shown are data points and mean ± SEM. (L) Quantitation of TSC2 in (J). Data are shown as in (K). (M) IP against TSC2 (TSC2 #2 or #3) or mock (rabbit IgG). n = 3. (N) IP against TSC2 (TSC2 #2) or mock (rabbit IgG); insulin/aa-stimulated shG3BP1 #1 cells (15 min). n = 4. (O) Quantitation of TSC1 in (N). Shown are data points and mean ± SEM. (P) Quantitation of G3BP1 in (N). Data are shown as in (O). (Q) Quantitation of LAMP1 in (N). Data are shown as in (O). See also |
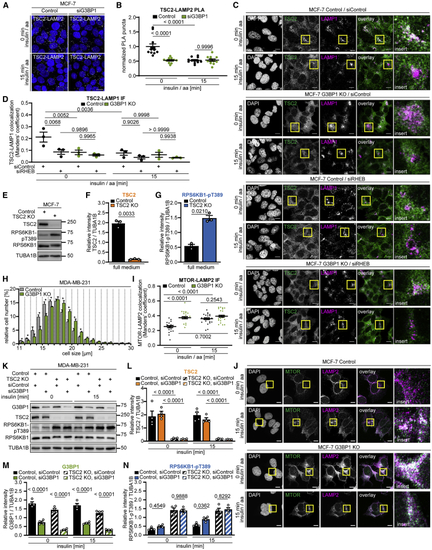
G3BP1 tethers the TSC complex to lysosomes (A) PLA of TSC2-LAMP2 in insulin/aa-stimulated siG3BP1 cells (15 min, 1 μM insulin). PLA puncta, white dots; nuclei, blue (DAPI). Scale bar, 100 μm. n = 4. (B) Quantitation of data in (A). Shown are data points and mean ± SEM. Control (0 min) normalized to 1. n = 12 technical replicates. (C) IF of LAMP1-TSC2 co-localization in G3BP1 KO cells transfected with siRHEB; insulin/aa stimulation (1 μM insulin). Overlay: white, LAMP1-TSC2 co-localization; green, TSC2; magenta, LAMP1; insert, magnification of the yellow square. Scale bar, 10 μm. n = 3. (D) Quantitation of data in (C). Shown are data points and mean ± SEM. (E) TSC2 KO cells in full medium. n = 3. (F) Quantitation of TSC2 in (E). Shown are data points and mean ± SEM. (G) Quantitation of RPS6KB1-pT389 in (E). Data are shown as in (F). (H) Size of G3BP1 KO cells. Mean ± SEM. *p < 0.05. n = 3. (I) Quantitation of data in (J). Shown are data points and mean ± SEM. (J) IF of MTOR-LAMP2 co-localization in G3BP1 KO cells. Overlay: white, MTOR-LAMP2 co-localization; green, MTOR; magenta, LAMP2; insert: magnification of the yellow square. Scale bar, 10 μm. n = 3. (K) Insulin-stimulated TSC2 KO cells transfected with siG3BP1. n = 4. (L) Quantitation of TSC2 in (K). Shown are data points and mean ± SEM. TSC2 was compared between control and TSC2 KO cells. (M) Quantitation of G3BP1 in (K). Shown are data points and mean ± SEM. G3BP1 was compared between siControl and siG3BP1 in control or TSC2 KO cells. (N) Quantitation of RPS6KB1-pT389 in (K). Data are shown as in (M). See also |
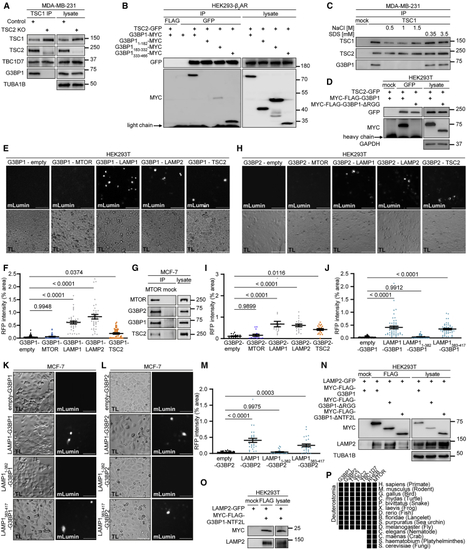
G3BPs bridge TSC2 to LAMP proteins (A) IP against TSC1 (TSC1 #1) or mock (rabbit IgG) in TSC2 KO cells. n = 3. (B) IP against GFP or FLAG; transfection with the indicated plasmids. n = 5. (C) IP against TSC1 (TSC1 #2) or mock (mouse IgG) incubated with NaCl or SDS. n = 3. (D) IP against GFP or mock (mouse IgG); transfection with the indicated plasmids. n = 3. (E) BiFC. Protein+C-terminal mLumin is indicated first; protein+N-terminal mLumin is indicated second. TL, transmitted light. Scale bar, 100 μm. n = 3. (F) Quantitation of data in (E). Shown are data points and mean ± SEM. (G) IP against MTOR or mock (rat IgG). n = 3. (H) BiFC. Protein+C-terminal mLumin is indicated first; protein+N-terminal mLumin is indicated second. TL, transmitted light. Scale bar, 100 μm. n = 4. (I) Quantitation of data in (H). Shown are data points and mean ± SEM. (J) Quantitation of data in (K). Shown are data points and mean ± SEM. (K) BiFC. Protein+C-terminal mLumin is indicated first; protein+N-terminal mLumin is indicated second. TL, transmitted light. Scale bar, 100 μm. n = 5. (L) BiFC. Protein+C-terminal mLumin is indicated first; protein+N-terminal mLumin is indicated second. TL, transmitted light. Scale bar, 100 μm. n = 3. (M) Quantitation of data in (L). Shown are data points and mean ± SEM. (N) IP against FLAG or mock (mouse IgG); transfection with the indicated plasmids. n = 3. (O) IP against FLAG or mock (mouse IgG); transfection with the indicated plasmids. n = 3. (P) Phylogenetic analysis. Black square, protein present in species. See also |
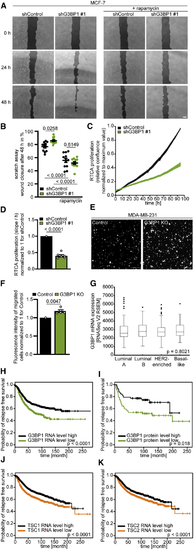
G3BP1 suppresses mTORC1-driven migration in breast cancer cells (A) Scratch assay with shG3BP1 #1 cells. Scale bar, 150 μm. n = 3. (B) Quantitation of data in (A). Shown are data points and mean ± SEM. (C) Real-time cell analysis (RTCA) of proliferation of shG3BP1 #1 MCF-7 cells. Mean ± SEM. n = 6. (D) Quantitation of data in (C). Shown are data points and mean ± SEM. (E) Transwell migration of G3BP1 KO cells (6–8 h). Scale bar, 150 μm. n = 5. (F) Quantitation of data in (E). Shown are data points and mean ± SEM. (G) (H) Relapse free survival (RFS) of individuals with breast cancer based on (I) RFS of individuals with breast cancer based on G3BP1 protein levels. (J) RFS of individuals with breast cancer based on (K) RFS of individuals with breast cancer based on |
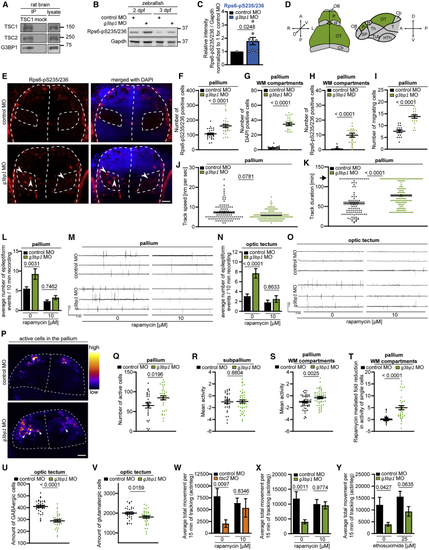
G3BP1 deficiency elicits mTORC1-driven neuronal phenotypes (A) IP against TSC1 (TSC1 #3) or mock (rabbit IgG). n = 2. (B) Zebrafish larvae injected with (C) Quantitation of Rps6-pS235/236 in (B), pooled for 2+3 dpf. Shown are data points and mean ± SEM. (D) Dorsal and lateral view of a zebrafish larva brain. P, pallium; OT, optic tectum; H, habenula; Cb, cerebellum; OB, olfactory bulb; SP, subpallium; Th, thalamus; Tub, tuberculum; T, tegmentum; HTh, hypothalamus. (E) IF of Rps6-pS235/236 in (F) Quantitation of Rps6-pS235/236-positive cells in the pallium in (E). Shown are data points and mean ± SEM. (G) Quantitation of cells in the WM in (E). Data are shown as in (F). (H) Quantitation of Rps6-pS235/236-positive cells in the WM in (E). Data are shown as in (F). (I) Quantitation of HuC-positive cells in (J) Movement speed of single HuC-positive cells. Data are shown as in (I). (K) Track duration of single HuC-positive cells. Data are shown as in (I). Arrow, maximum track duration. (L) Quantitation of epileptiform events in LFP recordings from the pallia of (M) Representative LFP recordings for (L). (N) Quantitation of epileptiform events in LFP recordings from optic tecta of (O) Representative LFP recordings for (N). (P) Neuronal activity in pallia of (Q) Quantitation of active neuronal cells in (P). Shown are data points and mean ± SEM. (R) Quantitation of mean neuronal activity in the subpallia of (S) Quantitation of mean neuronal activity in the WM of (T) Quantitation of rapamycin-mediated fold reduction in the activity of single cells in the WM of (U) Quantitation of GABAergic cells in optic tecta of (V) Quantitation of glutamatergic cells in optic tecta of (W) Locomotor activity of (X) Locomotor activity of (Y) Locomotor activity of See also |

G3BP1 does not alter mTORC1 activity upon arsenite stress but upon stimulation with insulin and nutrients, related to (A) Amino acid sequence of G3BP1. Protein domains indicated according to (B) IP against RPTOR (RPTOR#1 or #2) or mock (rat IgG). n = 3. (C) IP against MTOR or mock (rat IgG) from rapamycin-treated cells. n = 3. (D) IP against MTOR or mock (rat IgG) from Torin1 or MK2206treated cells. n = 3. (E) IF analysis of G3BP1 and EIF3A in arsenite exposed cells. Scale bar, 10 μm. n = 3. (F) Time course analysis of shG3BP1 #1 cells exposed to arsenite for up to 60 min. n = 3. (G) Quantitation of G3BP1 in (F). Mean ± SEM. (H) Quantitation of RPS6KB1-pT389 in (F). Data shown as in (G). (I) Time course analysis of siG3BP1 cells exposed to arsenite for up to 60 min. n = 3. (J) Quantitation of G3BP1 in (I). Mean ± SEM. (K) Quantitation of RPS6KB1-pST389 in (I). Data shown as in (J). (L) Insulin and amino acid (insulin/aa)-stimulated G3BP1 knockdown cells harboring a second shRNA sequence (shG3BP1 #2) targeting another exon than shG3BP1 #1 ( (M) Quantitation of G3BP1 in (L). Shown are data points and mean ± SEM. (N) Quantitation of RPS6KB1-pT389 in (L). Data shown as in (M). (O) Quantitation of RPS6-pS235/236 in (L). Data shown as in (M). (P) Insulin/aa-stimulated shG3BP1 #2. n = 4. (Q) Quantitation of G3BP1 in (P). Shown are data points and mean ± SEM. (R) Quantitation of RPS6KB1-pT389 in (P). Data shown as in (Q). (S) Quantitation of RPS6-pS235/236 in (P). Data shown as in (Q). (T) Insulin/aa-stimulated G3BP1 KO cells generated with a second independent guide RNA against G3BP1 (sgRNA # 2, (U) Quantitation of G3BP1 in (T). Shown are data points and mean ± SEM. (V) Quantitation of RPS6KB1-pT389 in (T). Data shown as in (U). |
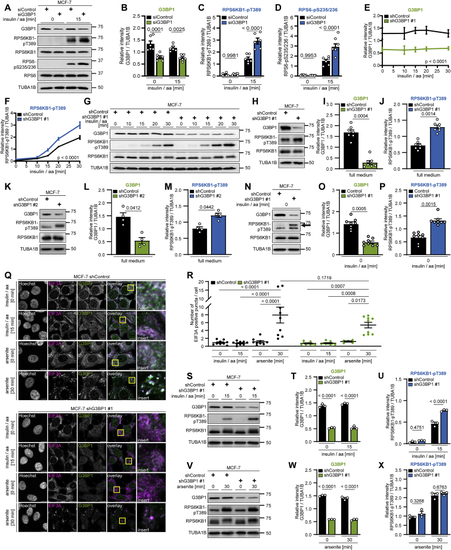
G3BP1 inhibits mTORC1 in cells without SGs, related to (A) Insulin/aa-stimulated siG3BP1 cells. n = 6. (B) Quantitation of G3BP1 in (A). Shown are data points and mean ± SEM. (C) Quantitation of RPS6KB1-pT389 in (A). Data shown as in (B). (D) Quantitation of RPS6-pS235/236 in (A). Data shown as in (B). (E) Quantitation of G3BP1 in (G). Mean ± SEM. (F) Quantitation of RPS6KB1-pT389 in (G). Data shown as in (E). (G) Time course analysis of shG3BP1 #1 cells, insulin/aa-stimulated for up to 30 min. n = 3. (H) shG3BP1 #1 cells cultured in full medium. n = 7. (I) Quantitation of G3BP1 in (H). Shown are data points and mean ± SEM. (J) Quantitation of RPS6KB1-pT389 in (H). Data shown as in (I). (K) shG3BP1 #2 cells cultured in full medium. n = 4. (L) Quantitation of G3BP1 in (K). Shown are data points and mean ± SEM. (M) Quantitation of RPS6KB1-pT389 in (K). Data shown as in (L). (N) Serum/aa-starved shG3BP1 #1 cells. Arrow, RPS6KB1-pT389 signal. n = 8, including re-analysis of improved contrast detections for data shown in (O) Quantitation of G3BP1 in (N). Shown are data points and mean ± SEM. n = 8, including re-analysis of data shown in (P) Quantitation of RPS6KB1-pT389 in (N). Data shown as in (O). n = 8, including re-analysis of improved contrast detections for data shown in (Q) IF of shG3BP1 #1 cells. Cells were either serum/aa-starved and stimulated with insulin/aa for 15 min; or serum-starved and treated with arsenite for 30 min. Overlay: white, EIF3A and G3BP1 co-localization; magenta, EIF3A; green, G3BP1; inserts, magnifications of yellow square. Scale bar, 10 μm. n = 3, except shG3BP1 #1, arsenite [0 min], n = 2. (R) Quantitation of data shown in (Q). Shown are data points and mean ± SEM. (S) Immunoblot performed in parallel to IF data in (Q). Insulin/aa-stimulated shG3BP1 #1 cells. n = 3. (T) Quantitation of G3BP1 in (S). Shown are data points and mean ± SEM. (U) Quantitation of RPS6KB1-pT389 in (S). Data shown as in (T). (V) Immunoblot performed in parallel to IF data in (Q). Arsenite-exposed shG3BP1 #1 cells. n = 3. (W) Quantitation of G3BP1 in (V). Shown are data points and mean ± SEM. (X) Quantitation of RPS6KB1-pT389 in (V). Data shown as in (W). |
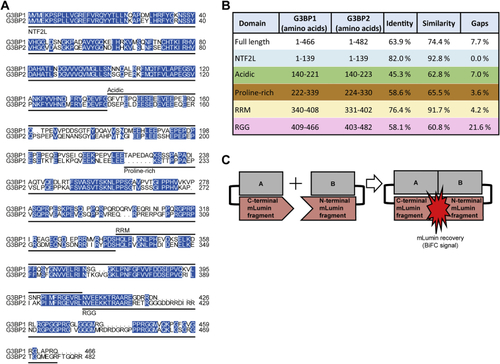
Sequence similarity between G3BP1 and G3BP2, related to Figure 2 (A) Sequence alignment of human G3BP1 (UniProt: Q13283) and G3BP2 (UniProt: Q9UN86). Protein domains are indicated according to Reineke and Lloyd (2015). Blue, identical residues. (B) Sequence similarities of human G3BP1 and G3BP2. Sequence alignments done based on the domain regions defined for G3BP1 in Reineke and Lloyd (2015). Colors correspond to the domains marked in Figure S1A. (C) Scheme of plasmids used for BiFC. |
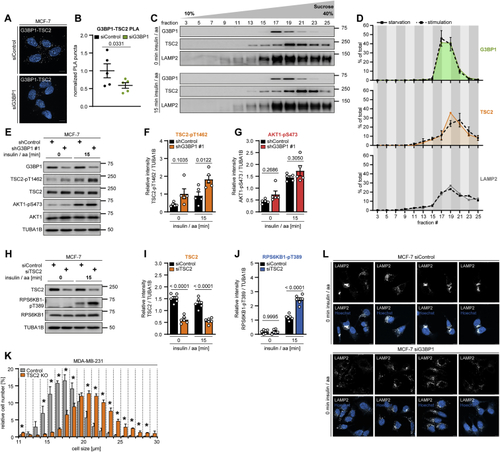
G3BP1 phenocopies lysosomal TSC functions, related to (A) PLA of G3BP1-TSC2 in serum/aa-starved siG3BP1 cells. PLA puncta, white dots; nuclei, blue (DAPI). Scale bar, 10 μm. n = 3. (B) Quantitation of data in (A). Shown are data points and mean ± SEM. n = 5 technical replicates. (C) Sucrose density gradient of serum/aa-starved or insulin/aa-stimulated MCF-7 cells. n = 3. (D) Quantitation of data in (C). Area under the curve highlighted in green (G3BP1), orange (TSC2), and gray (LAMP2), starved condition; dashed lines, stimulated condition. Mean ± SEM. (E) Insulin/aa-stimulated shG3BP1 #1 cells. n = 5. (F) Quantitation of TSC2-pT1462 in (E). Shown are data points and mean ± SEM. (G) Quantitation of AKT1-pS473 in (E). Data shown as in (F). (H) Insulin/aa-stimulated siTSC2 cells. n = 6. (I) Quantitation of TSC2 in (H). Shown are data points and mean ± SEM. (J) Quantitation of RPS6KB1-pT389 in (H). Data shown as in (I). (K) Cell size of TSC2 KO cells. Mean ± SEM. *p < 0.05. n = 3. (L) IF of LAMP2 positioning in serum/aa-starved siG3BP1 cells. White, LAMP2; blue (Hoechst), nuclei. Scale bar, 10 μm. n = 3. |
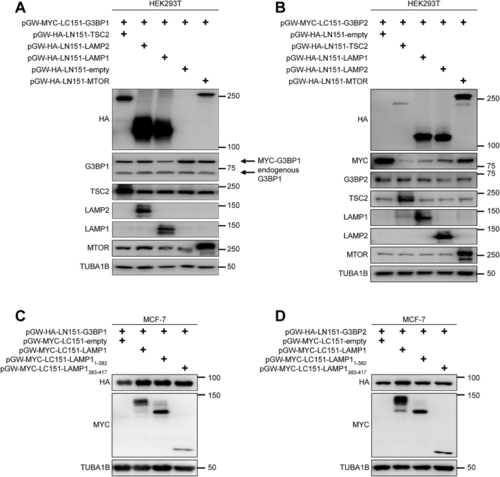
Expression of BiFC constructs, related to (A) Expression of BiFC fusion proteins used in (B) Expression of BiFC fusion proteins used in (C) Expression of BiFC fusion proteins used in (D) Expression of BiFC fusion proteins used in |
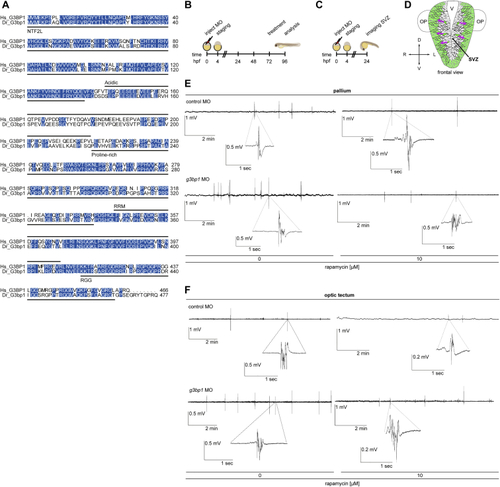
Background information for the zebrafish experiments, related to (A) Sequence alignment of human (Hs) G3BP1 (UniProt: (B) Treatment scheme of the (C) Treatment scheme for the neuronal migration experiments with the (D) Schematic frontal view of the zebrafish front brain at 24 hpf. Green, HuC expressing cells. Magenta arrows, direction of migration from the SVZ to outer layers. V, ventricle; OP, olfactory placodes. (E) LFPs from larval pallia. Representative 10 min recordings of non-invasive LFPs from (F) LFPs from larval optic tecta. Representative 10 min recordings of non-invasive LFPs from |
Reprinted from Cell, 184(3), Prentzell, M.T., Rehbein, U., Cadena Sandoval, M., De Meulemeester, A.S., Baumeister, R., Brohée, L., Berdel, B., Bockwoldt, M., Carroll, B., Chowdhury, S.R., von Deimling, A., Demetriades, C., Figlia, G., Genomics England Research Consortium, de Araujo, M.E.G., Heberle, A.M., Heiland, I., Holzwarth, B., Huber, L.A., Jaworski, J., Kedra, M., Kern, K., Kopach, A., Korolchuk, V.I., van 't Land-Kuper, I., Macias, M., Nellist, M., Palm, W., Pusch, S., Ramos Pittol, J.M., Reil, M., Reintjes, A., Reuter, F., Sampson, J.R., Scheldeman, C., Siekierska, A., Stefan, E., Teleman, A.A., Thomas, L.E., Torres-Quesada, O., Trump, S., West, H.D., de Witte, P., Woltering, S., Yordanov, T.E., Zmorzynska, J., Opitz, C.A., Thedieck, K., G3BPs tether the TSC complex to lysosomes and suppress mTORC1 signaling, 655-674.e27, Copyright (2021) with permission from Elsevier. Full text @ Cell