
Figure 5
- ID
- ZDB-FIG-210219-19
- Publication
- Prentzell et al., 2021 - G3BPs tether the TSC complex to lysosomes and suppress mTORC1 signaling
- Other Figures
- All Figure Page
- Back to All Figure Page
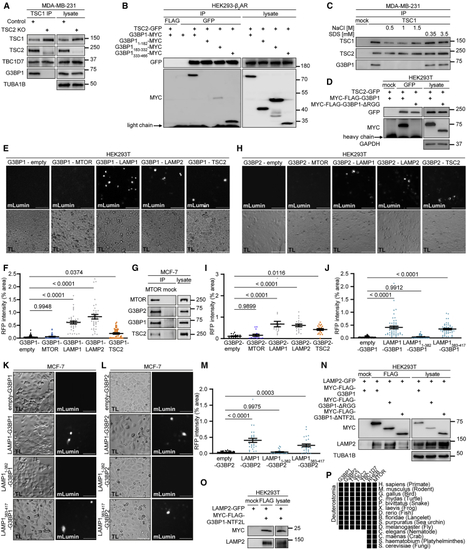
G3BPs bridge TSC2 to LAMP proteins (A) IP against TSC1 (TSC1 #1) or mock (rabbit IgG) in TSC2 KO cells. n = 3. (B) IP against GFP or FLAG; transfection with the indicated plasmids. n = 5. (C) IP against TSC1 (TSC1 #2) or mock (mouse IgG) incubated with NaCl or SDS. n = 3. (D) IP against GFP or mock (mouse IgG); transfection with the indicated plasmids. n = 3. (E) BiFC. Protein+C-terminal mLumin is indicated first; protein+N-terminal mLumin is indicated second. TL, transmitted light. Scale bar, 100 μm. n = 3. (F) Quantitation of data in (E). Shown are data points and mean ± SEM. (G) IP against MTOR or mock (rat IgG). n = 3. (H) BiFC. Protein+C-terminal mLumin is indicated first; protein+N-terminal mLumin is indicated second. TL, transmitted light. Scale bar, 100 μm. n = 4. (I) Quantitation of data in (H). Shown are data points and mean ± SEM. (J) Quantitation of data in (K). Shown are data points and mean ± SEM. (K) BiFC. Protein+C-terminal mLumin is indicated first; protein+N-terminal mLumin is indicated second. TL, transmitted light. Scale bar, 100 μm. n = 5. (L) BiFC. Protein+C-terminal mLumin is indicated first; protein+N-terminal mLumin is indicated second. TL, transmitted light. Scale bar, 100 μm. n = 3. (M) Quantitation of data in (L). Shown are data points and mean ± SEM. (N) IP against FLAG or mock (mouse IgG); transfection with the indicated plasmids. n = 3. (O) IP against FLAG or mock (mouse IgG); transfection with the indicated plasmids. n = 3. (P) Phylogenetic analysis. Black square, protein present in species. See also |
Reprinted from Cell, 184(3), Prentzell, M.T., Rehbein, U., Cadena Sandoval, M., De Meulemeester, A.S., Baumeister, R., Brohée, L., Berdel, B., Bockwoldt, M., Carroll, B., Chowdhury, S.R., von Deimling, A., Demetriades, C., Figlia, G., Genomics England Research Consortium, de Araujo, M.E.G., Heberle, A.M., Heiland, I., Holzwarth, B., Huber, L.A., Jaworski, J., Kedra, M., Kern, K., Kopach, A., Korolchuk, V.I., van 't Land-Kuper, I., Macias, M., Nellist, M., Palm, W., Pusch, S., Ramos Pittol, J.M., Reil, M., Reintjes, A., Reuter, F., Sampson, J.R., Scheldeman, C., Siekierska, A., Stefan, E., Teleman, A.A., Thomas, L.E., Torres-Quesada, O., Trump, S., West, H.D., de Witte, P., Woltering, S., Yordanov, T.E., Zmorzynska, J., Opitz, C.A., Thedieck, K., G3BPs tether the TSC complex to lysosomes and suppress mTORC1 signaling, 655-674.e27, Copyright (2021) with permission from Elsevier. Full text @ Cell